the Conservation Data Lab: coding, creating and conserving. Explore our projects, and geeky things we dredge up from the crazy internet.
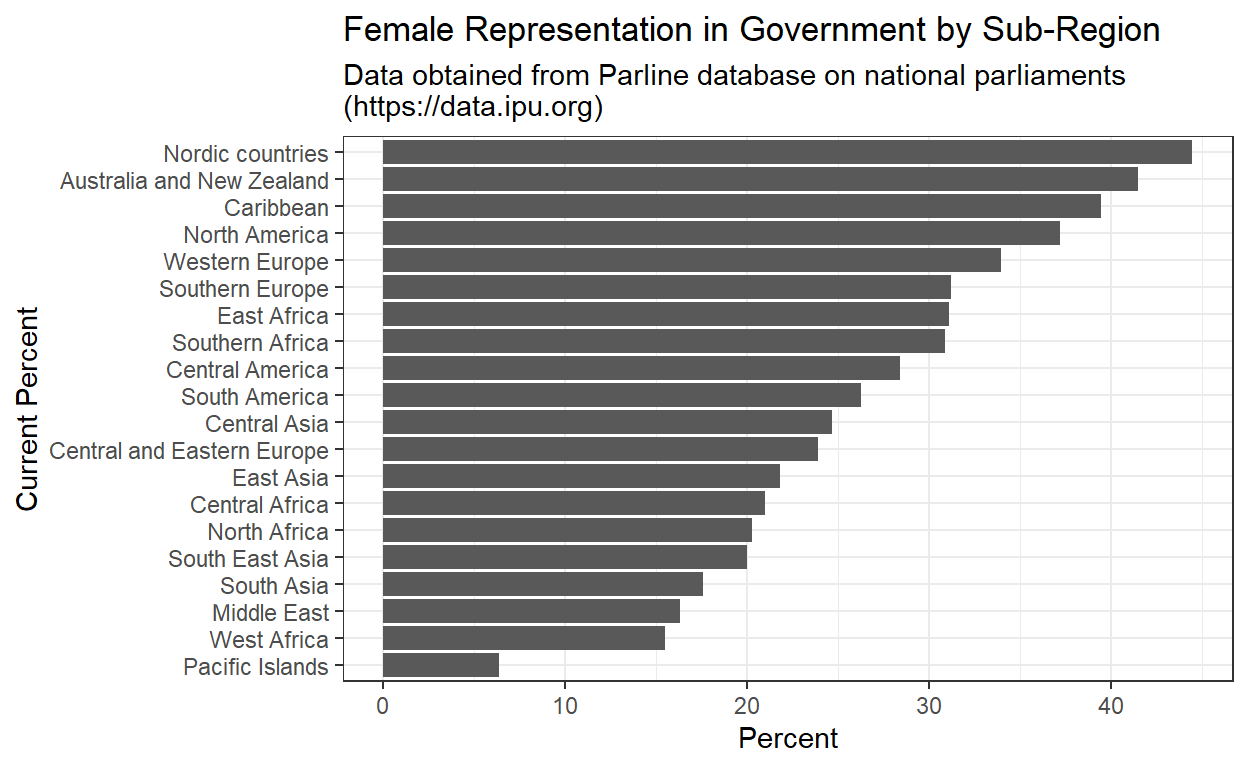
Women in governments around the world
Using data from the World Bank and an amazing tutorial by Dylan Anderson I explore the proportion of women in govenrment around the world.
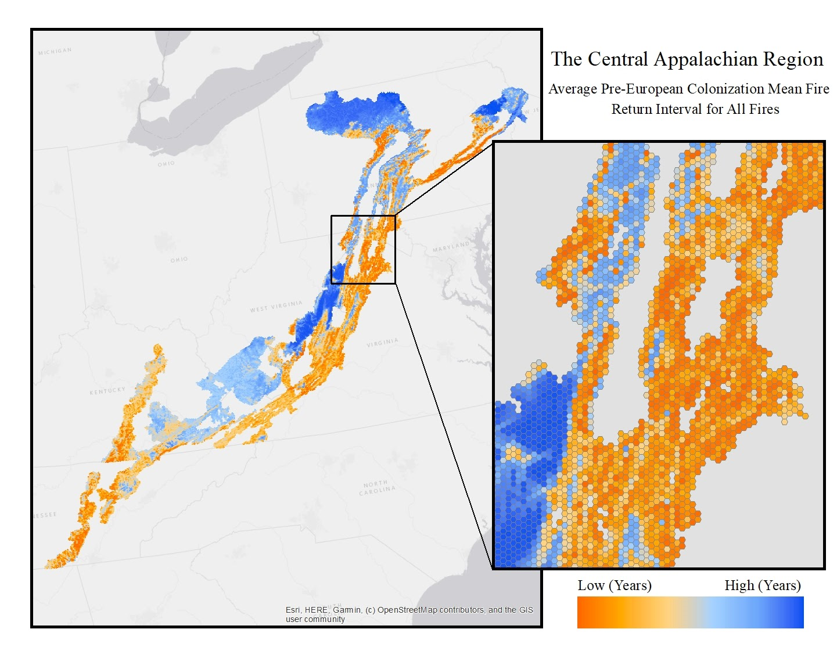
Did you know?
There was a substantial amount of fire every year in the Appaliachian Region prior to European Colinization? Many of the ecosystems there are dominated by oaks and pines, which are beautifully adapted to fire. Many of these species struggle to perpetual without it! Currently these forests are changing as we have become super effective at suppressing fires. Managers want to know more about historical fire patterns-that's where I stepped in.
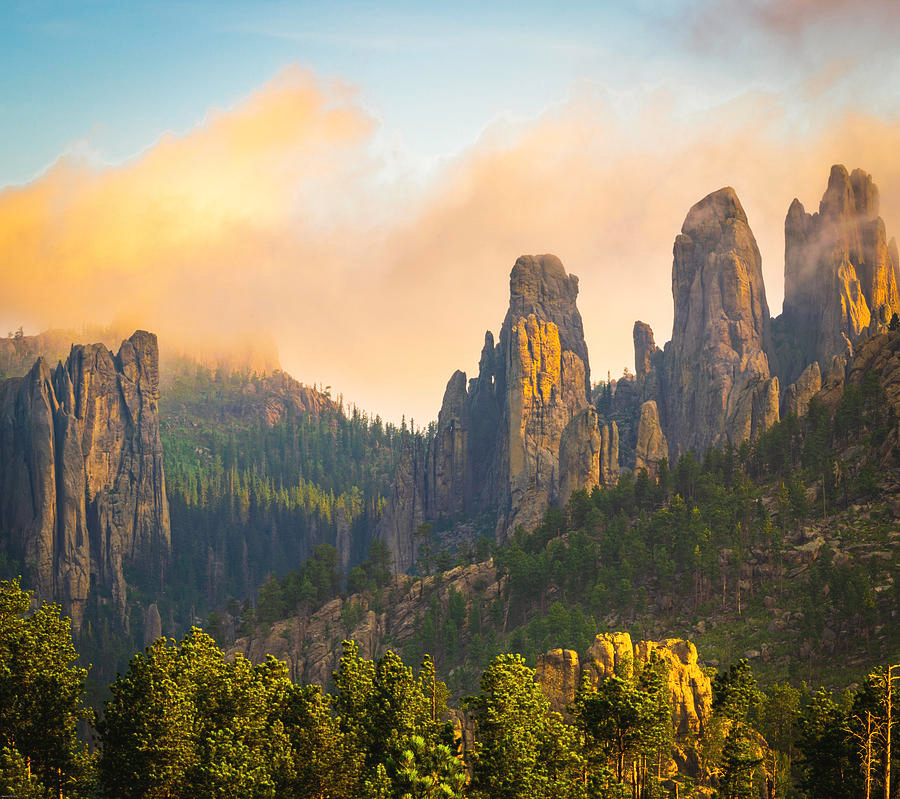
Assessing the Vegetation of Black Hills with R, LANDFIRE data and QGIS
Effective conservation begins with planning, including a situation assessment. Here we aimed to help the western South Dakota chapter of The Nature Conservancy understand not only the vegetation of the Black Hills, but also the input data and constraints. We used R, QGIS and LANDFIRE data to get a quick glimpse of where the ecosystems are, and their structural characteristics.
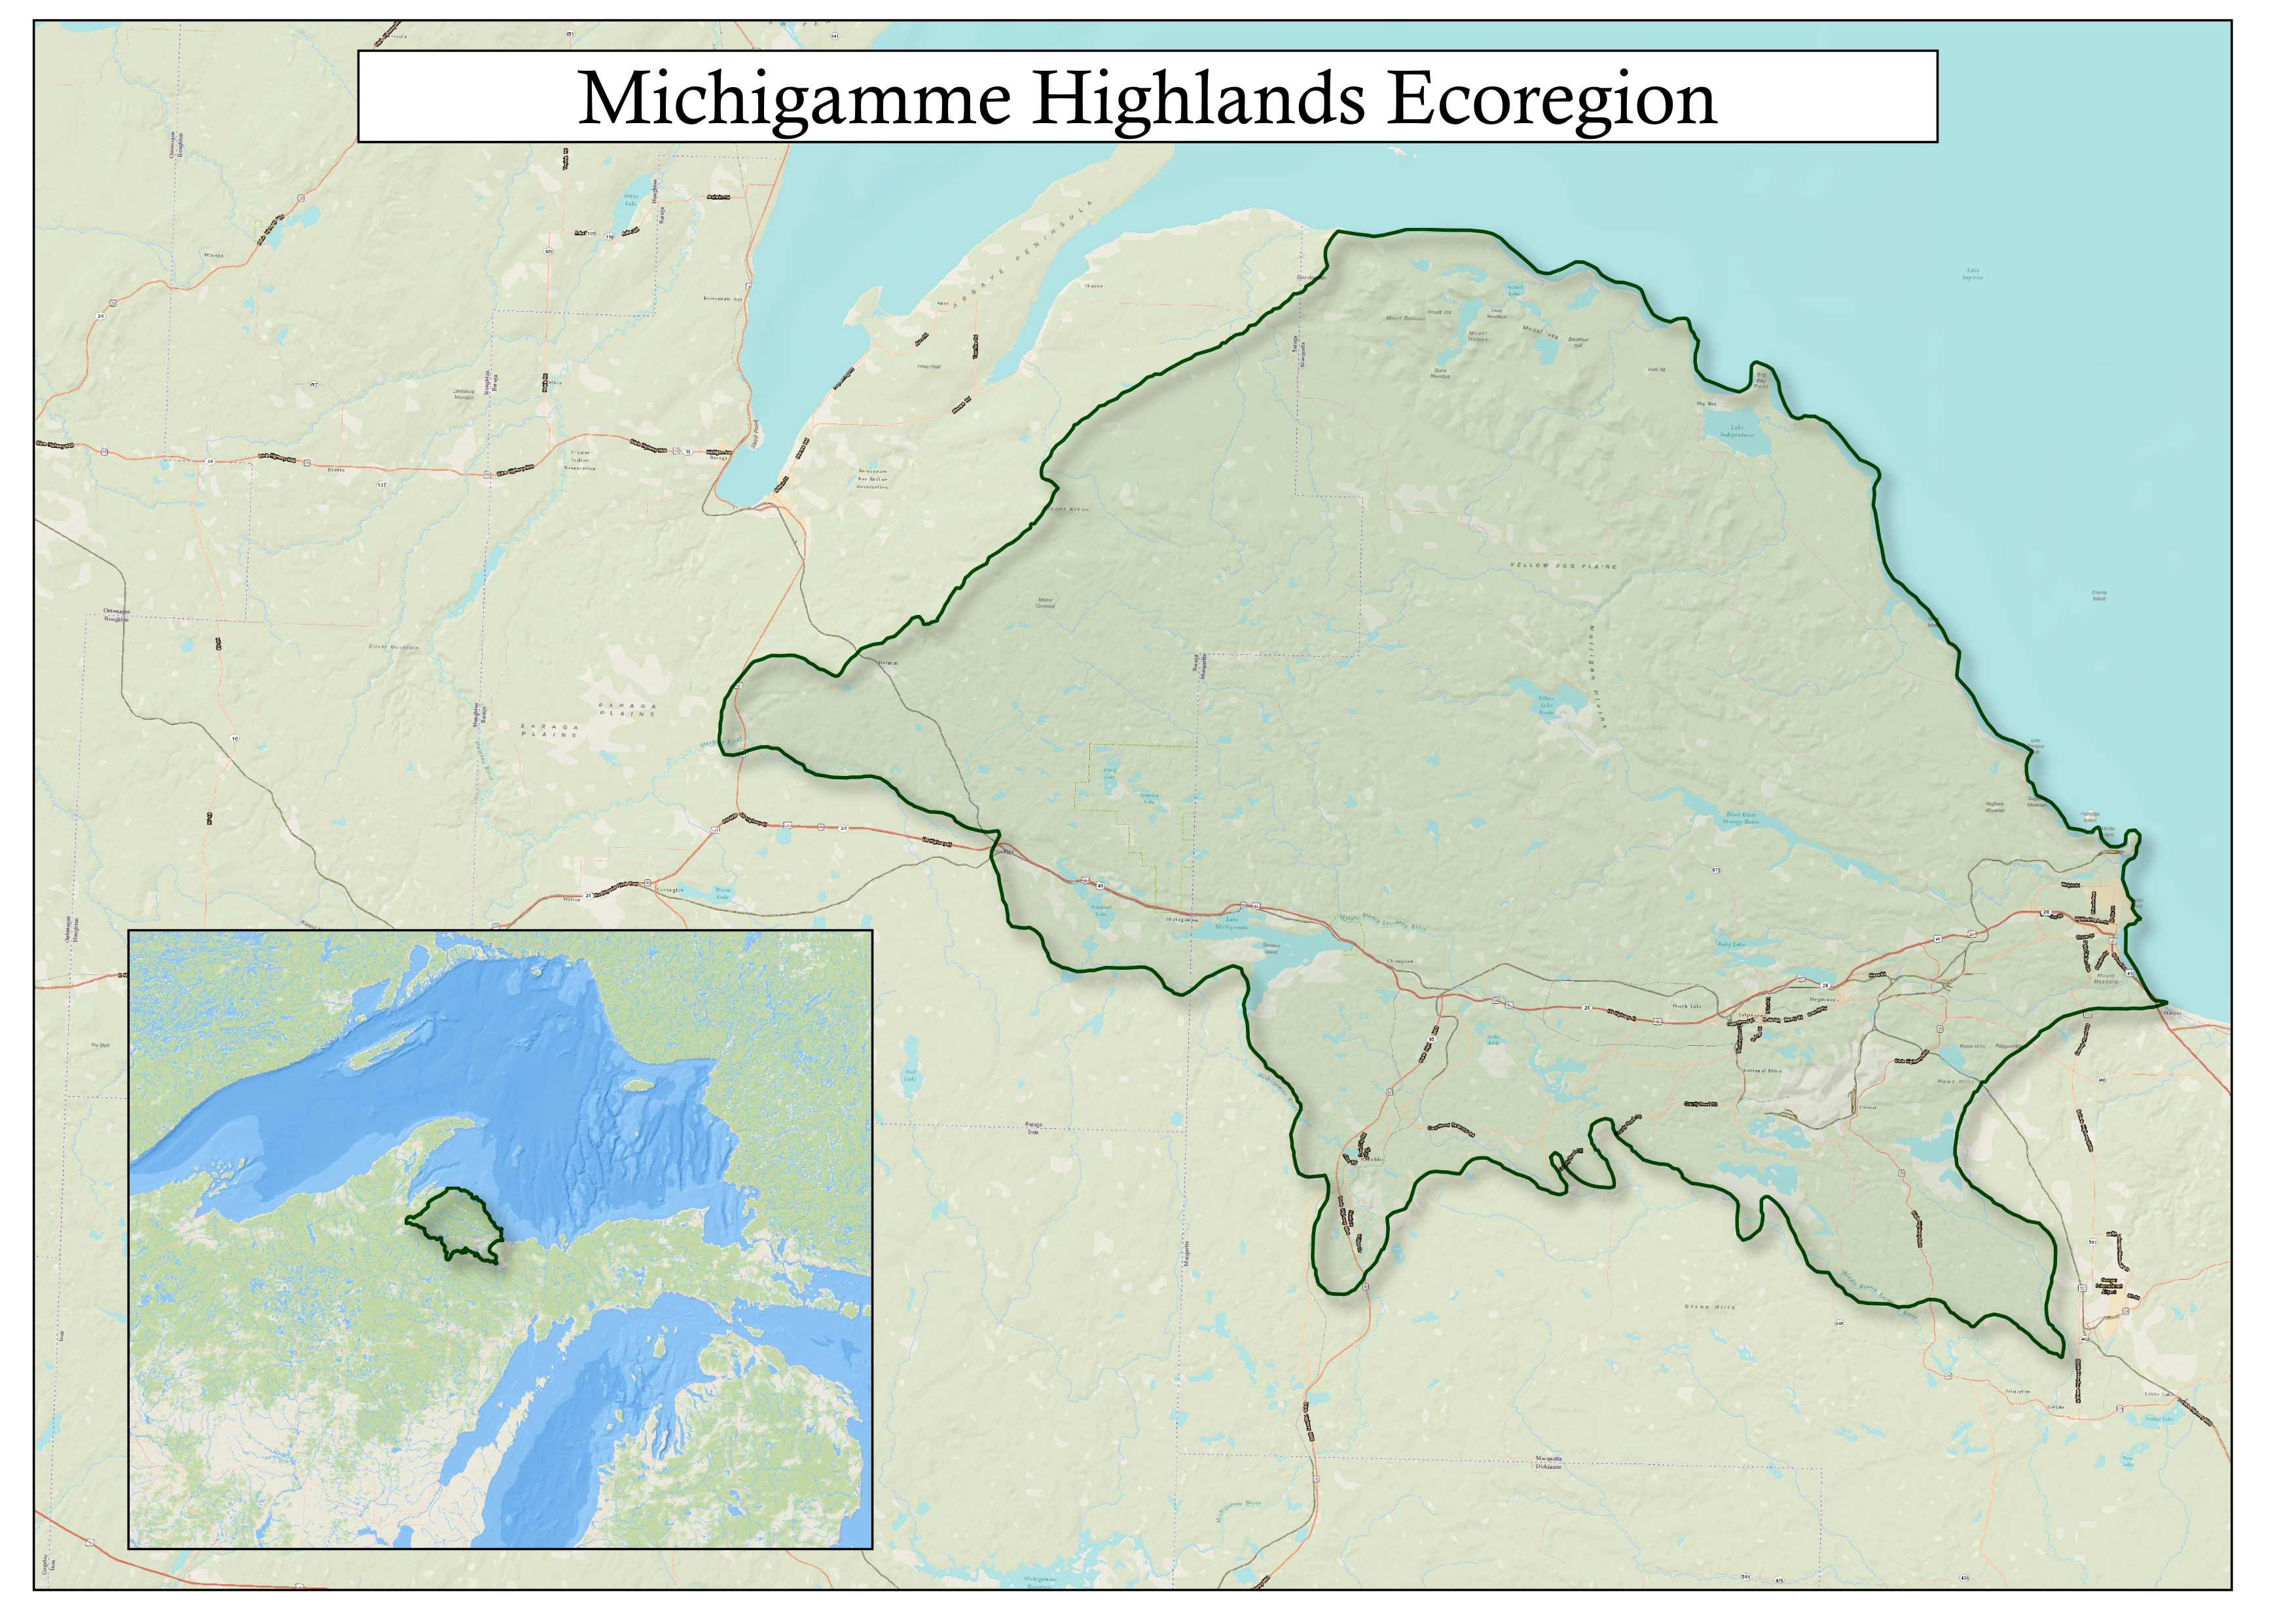
The state of forested land in the Upper Peninsula of Michigan: exploring LANDFIRE data to gather a clearer picture
A key step in conservation planning is situation analysis. Here we present a rapid analysis of the ecological communities of the Michigamme Highlands of the Upper Peninsula of Michigan powered by R and LANDFIRE data.
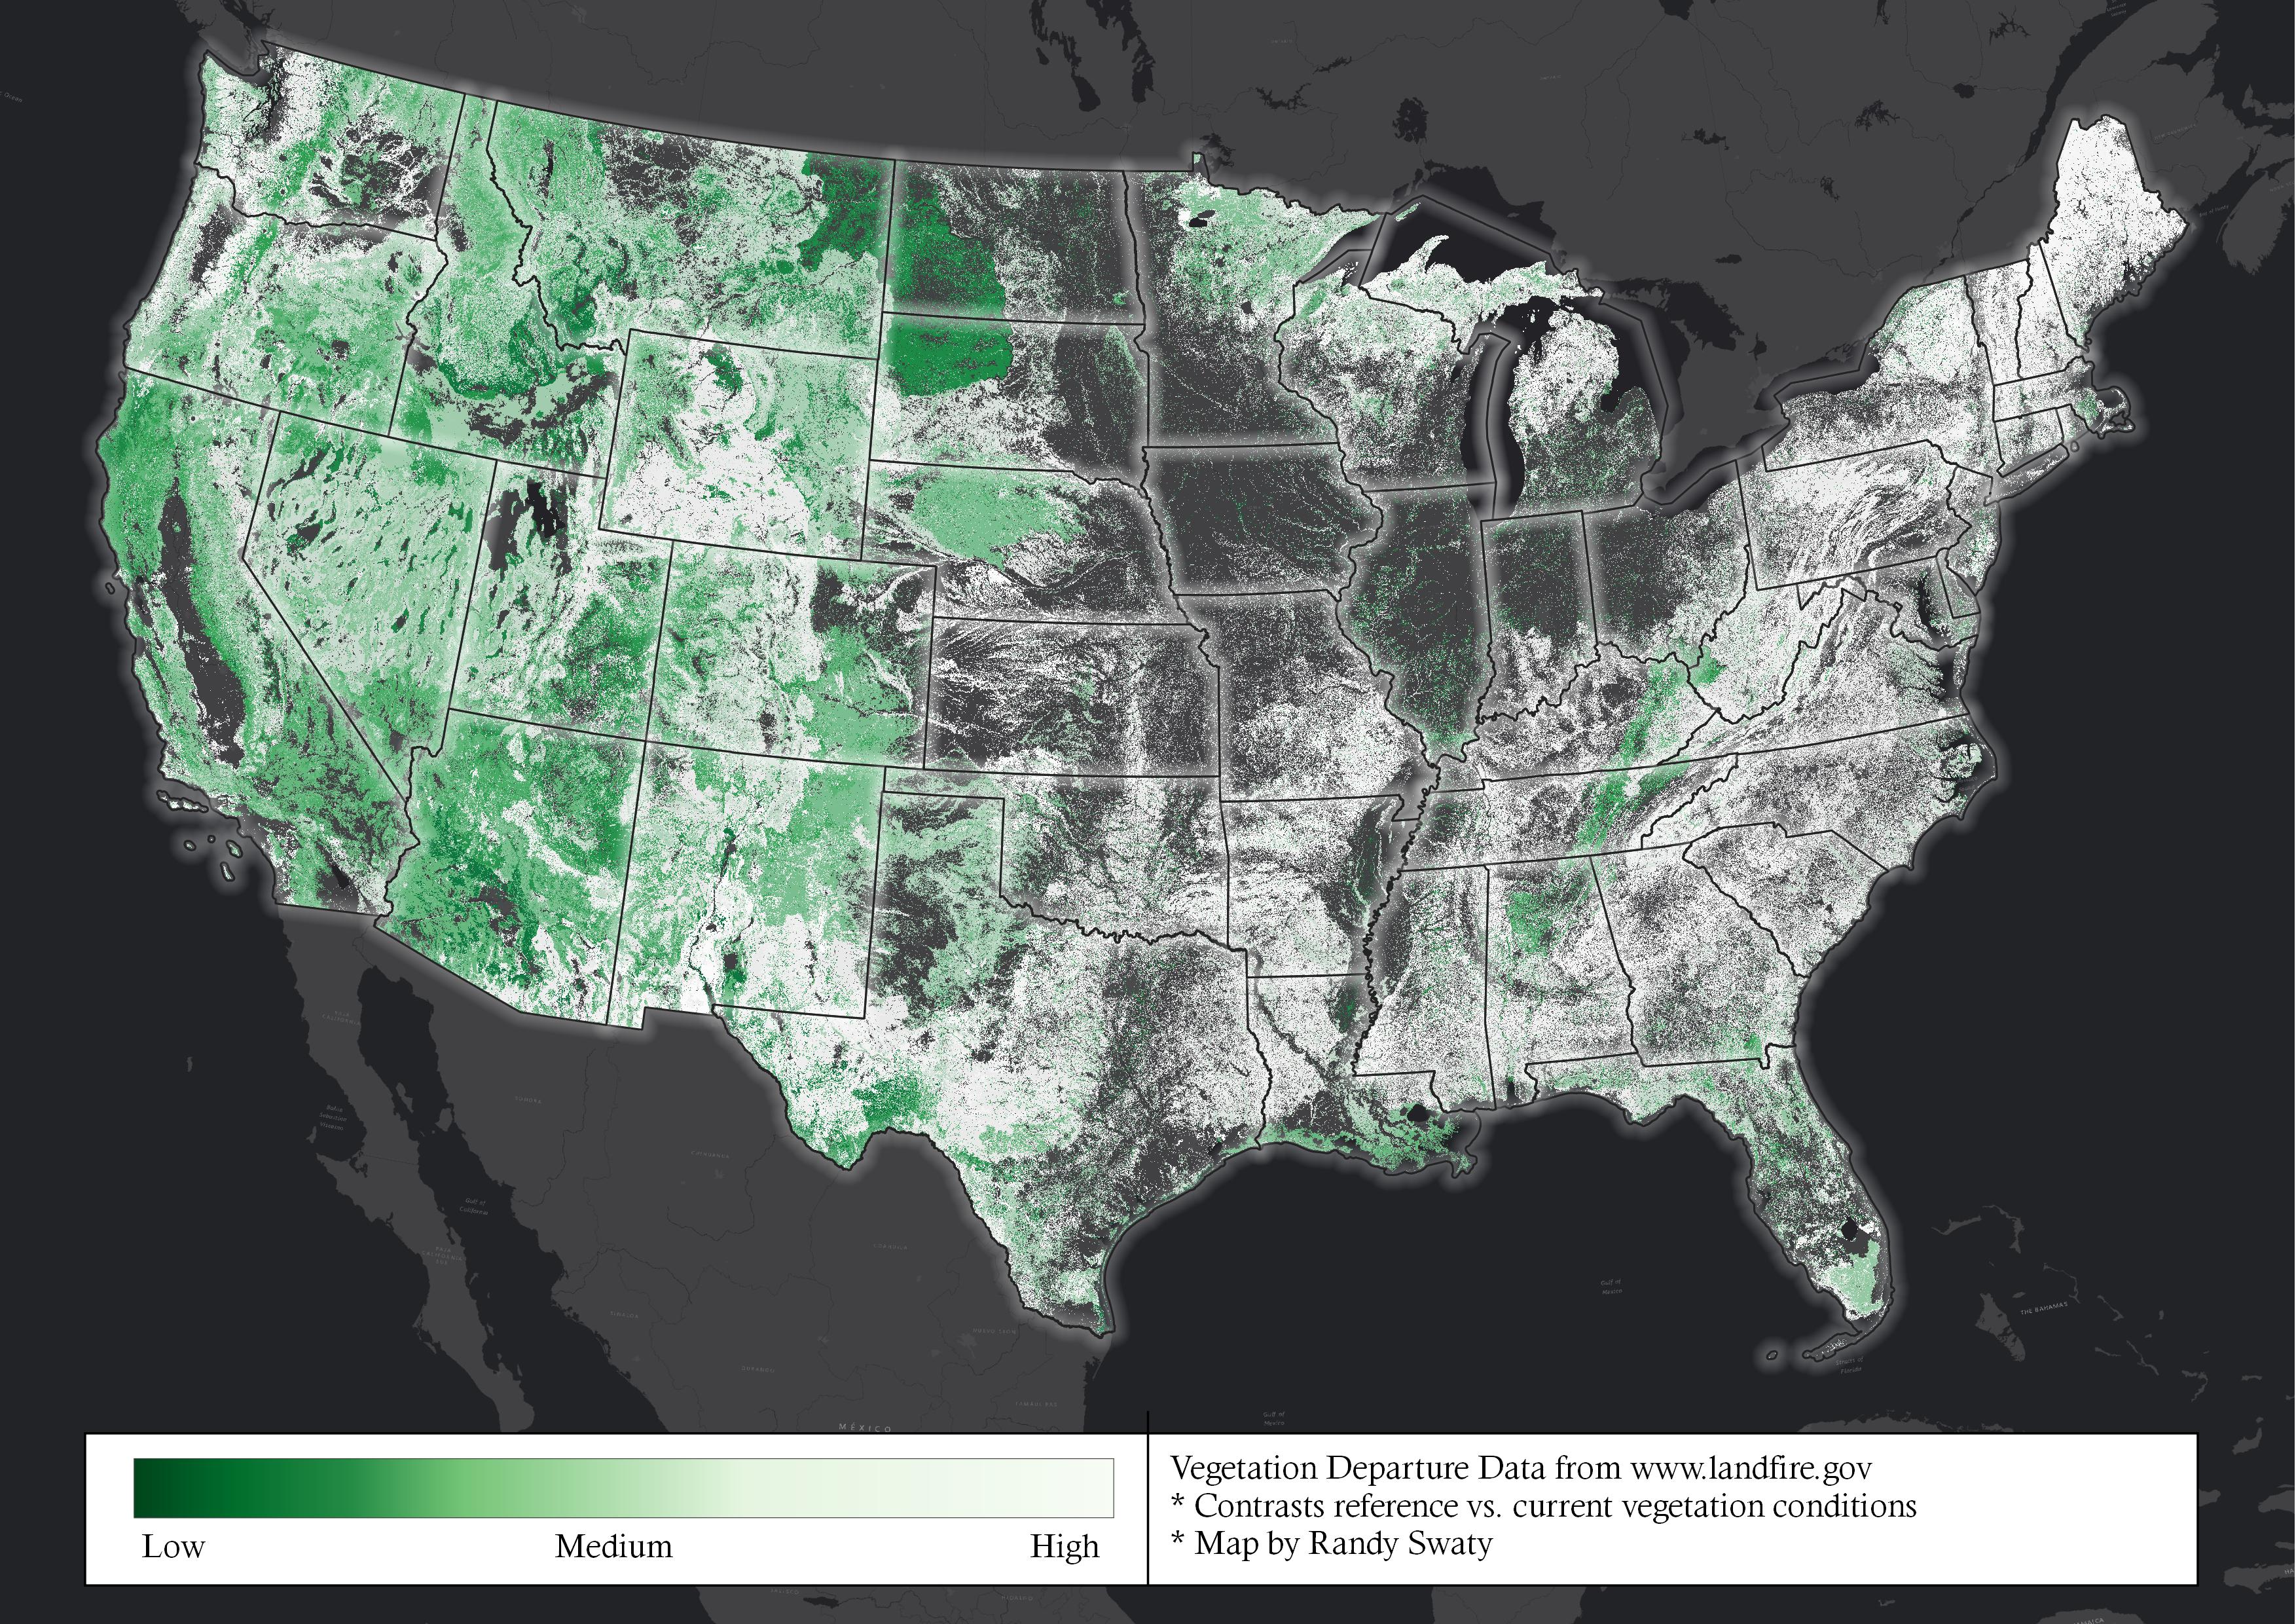
Vegetation Conditions for the Coterminous U.S.
It is difficult to map vegetation conditions, period. It's especially difficult to do it for large places. For one, condition implies good or bad-compared to what? Second, where does the data come from? Here I explore the way LANDFIRE defines and maps condition with a metric called "Vegetation Departure".
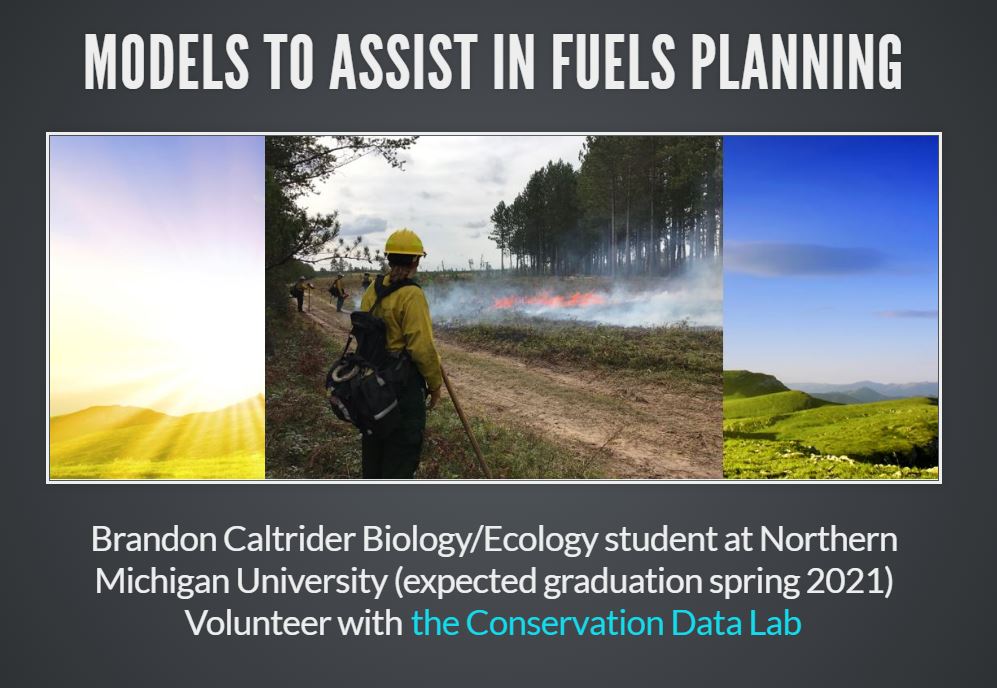
Fuel Modeling for National Forests
Land managers, and citizens need to know where wildfires and their smoke are likely to go, and where to intervene. Brandon Caltrider reviews several tools aimed at these challenges.
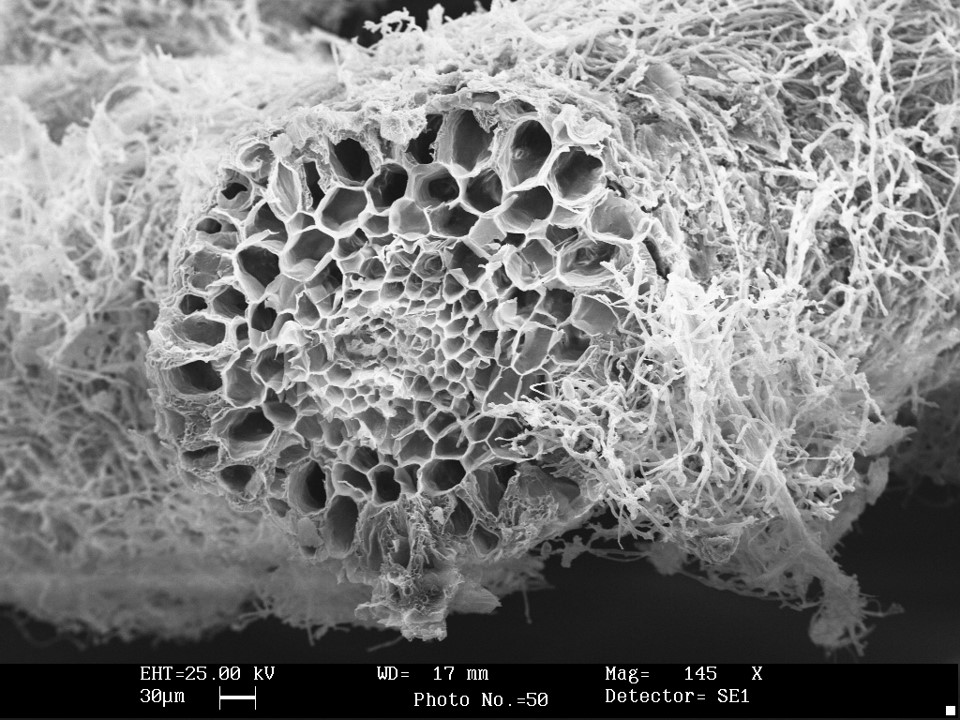
Exploring the wood-wide web with Celeste Basken and Randy Swaty
Did you know that many plants are connected via an underground fungal network? Did you realize that ~95% of beer is water and that more than 50% of our water comes from forests? Watch Celeste's video then join an OktoberForest celebration presentation on October 8th at 7pm (Eastern) to learn more.
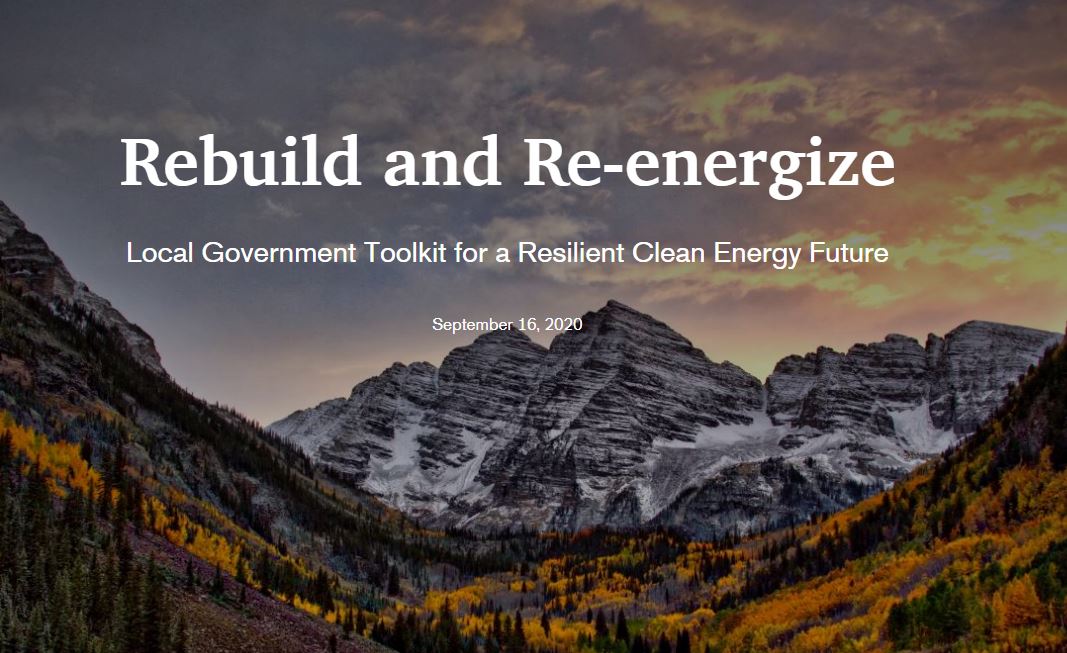
Re-energizing Colorado: a StoryMap Toolkit
Rachel Meier and colleagues from Lotus Engineering and Sustainability created an ArcGIS StoryMap that empowers local and state communities to move towards a more resilient and clean future. With beautiful visuals, interactive features and a robust set of resources it inspires exploration and action.
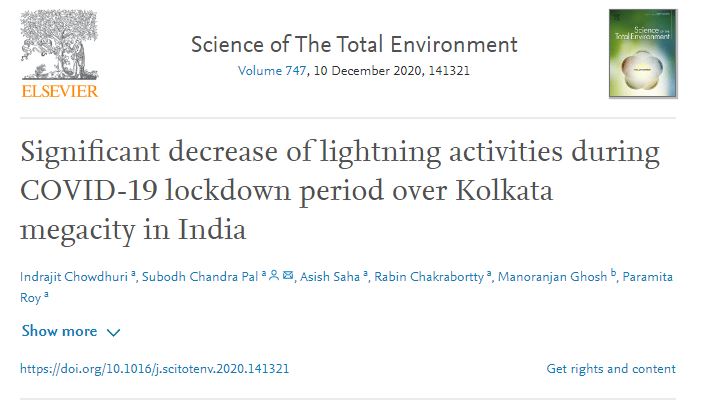
A butterfly in India...?
In a recent articles researchers (Chowdhuri et al.,2020) reported that lightning has descreased during Covid lockdowns. What's happening?
Welcome Rachel Meier
A big welcome to new mentor, Rachel Meier. Rachel is a Research Associate with Lotus Engineering, hiker, map lover, traveler who will be working with CDL members Cassie and Cassidy.
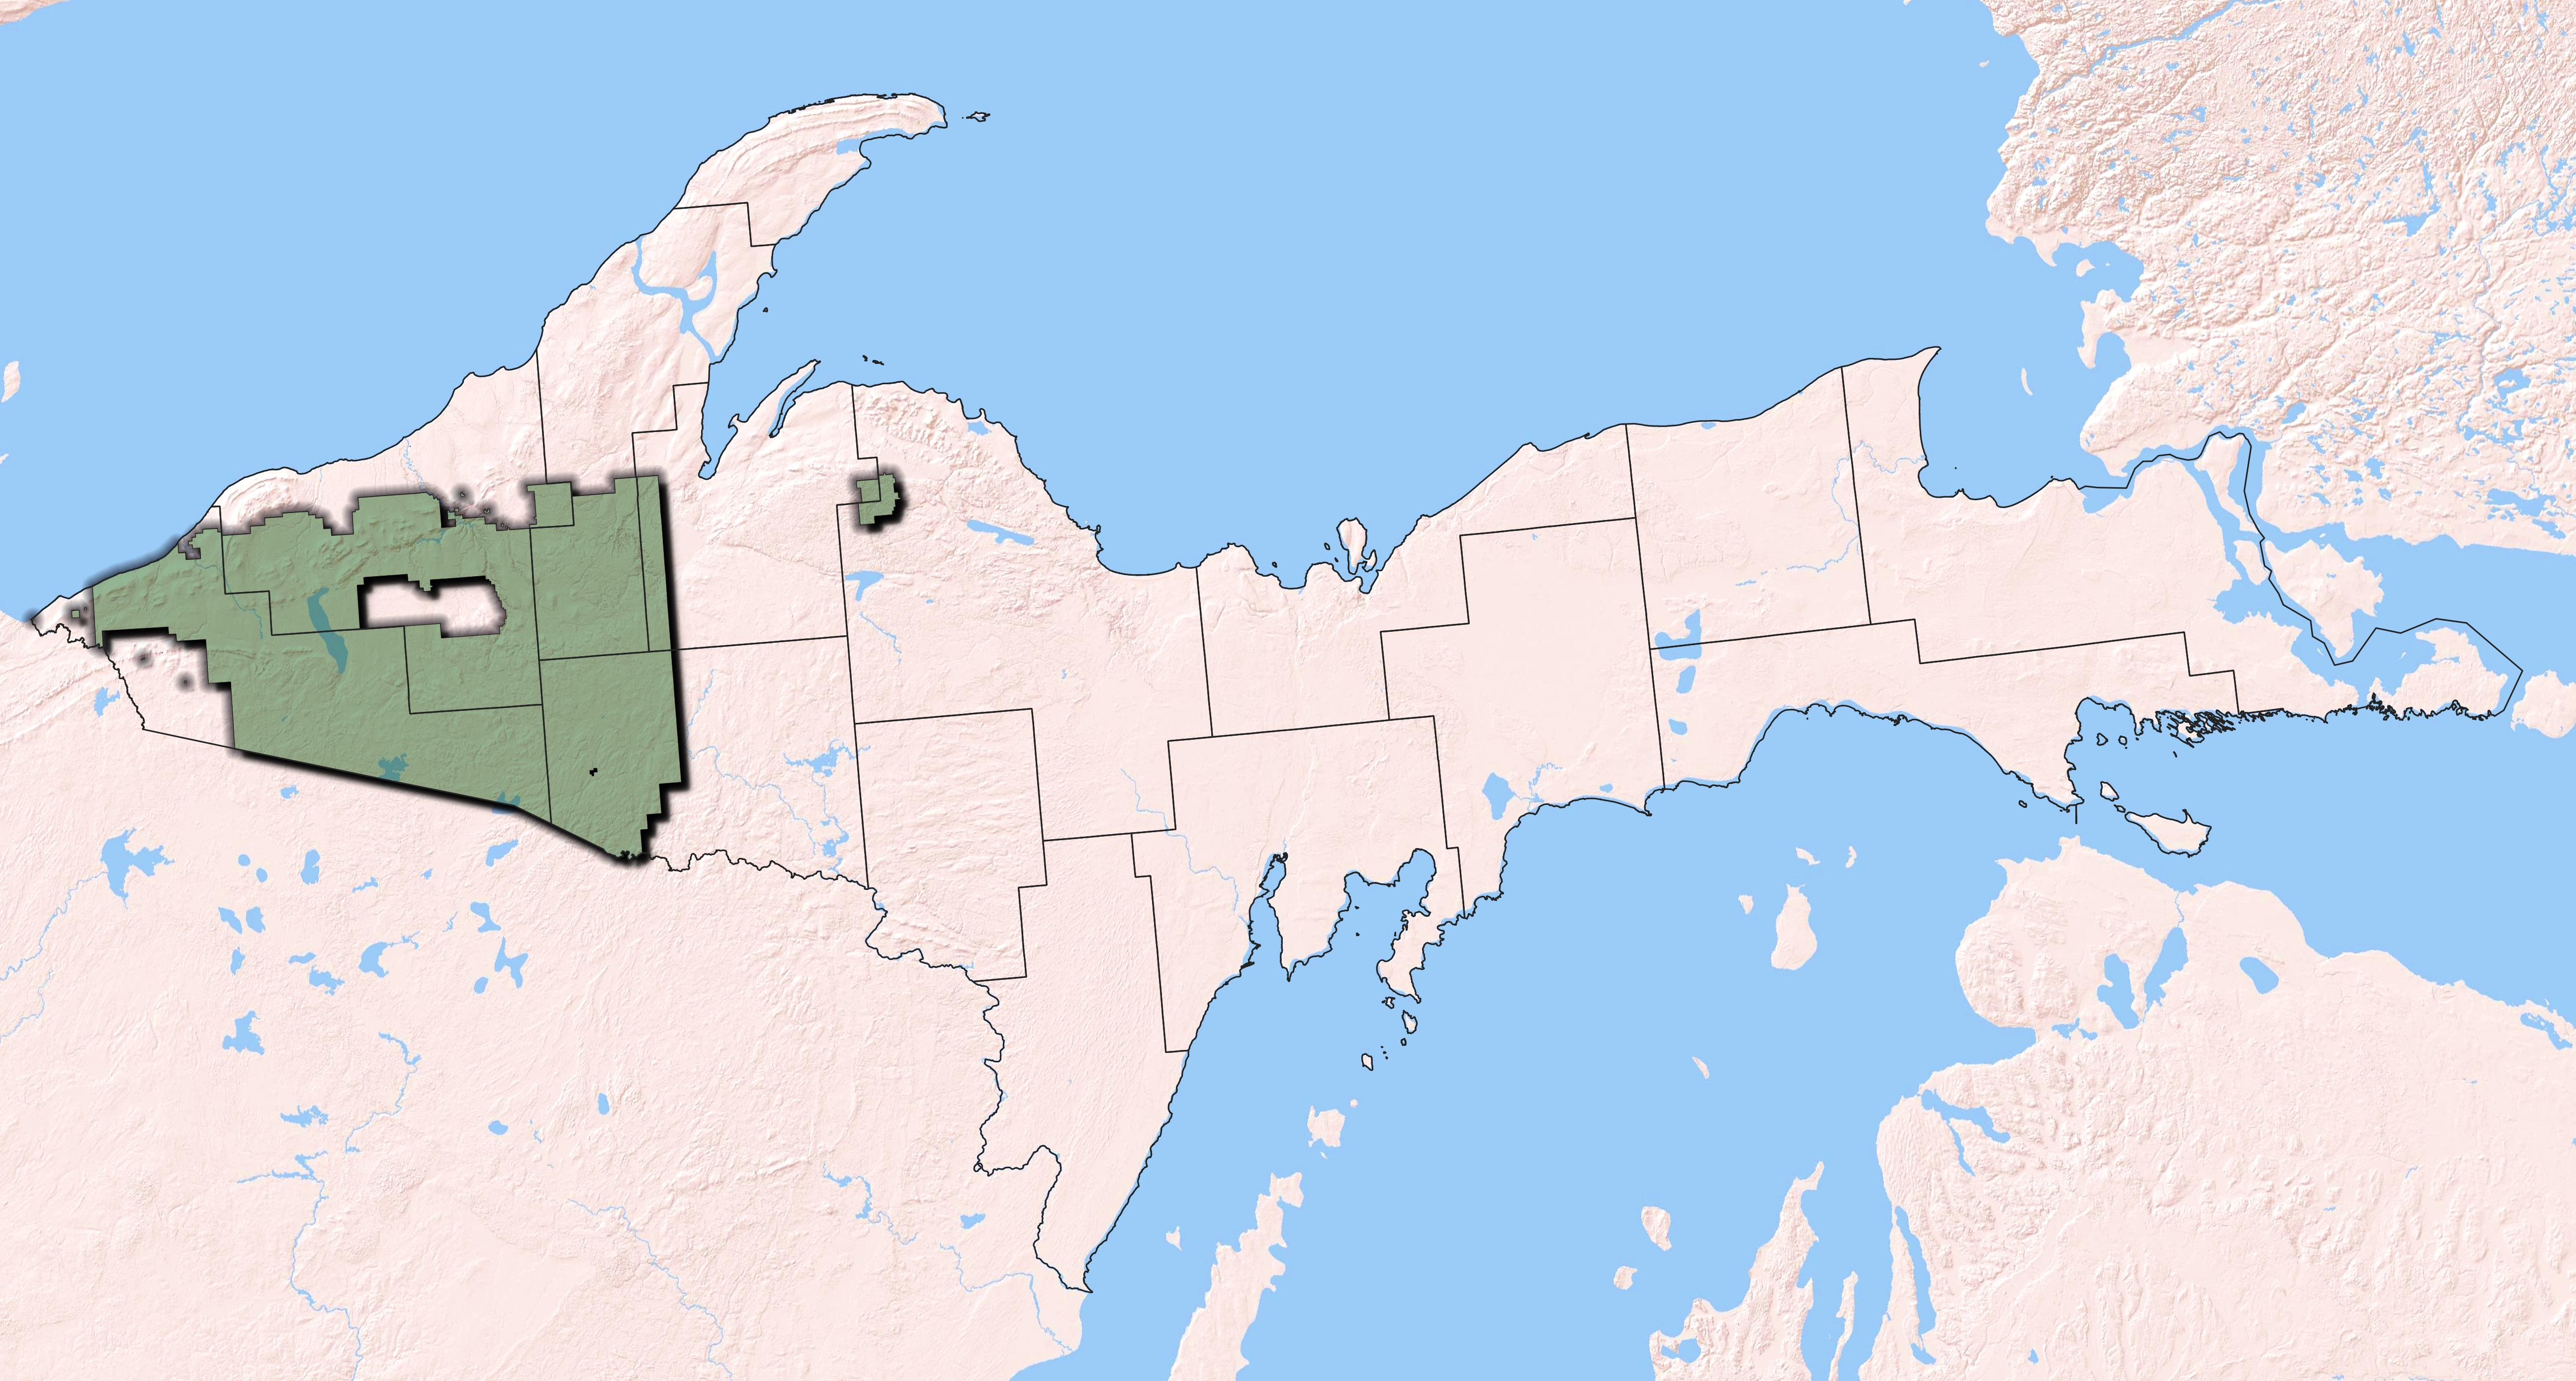
Rapid Assessment of the Ottawa NF with 2 example interactive charts, code and data
Most simply land managers need to know what they've got, i.e., how much of each ecosystem, the condition of those ecosystems and what the potential for future management might be. Using LANDFIRE data, R and R-Shiny we delivered a quick assessment of the Ottawa National Forest in hopes of priming the conversation pump. This is just the beginning of deciding what to do where.