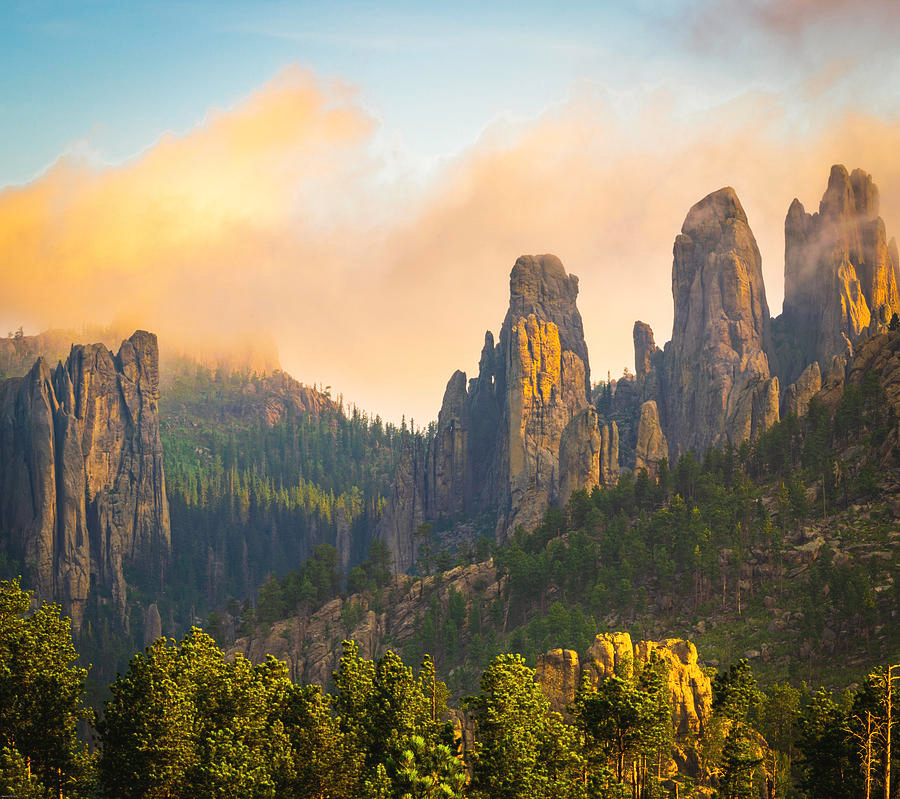
(Image taken by Aaron Geraud https://pixels.com/featured/1-black-hills-sunrise-aaron-geraud.html)
If you are like me, you do not know where the Black Hills were until looking it up. The Black Hills in South Dakota is where Mount Rushmore (the iconic land monument featuring a sculpture of heads of four presidents) is found. Broadly the landscape includes forests, the Great Plains grasslands, and Rocky Mountains alpine ecosystems. The Black Hills is represented by a variety of plant types and species.
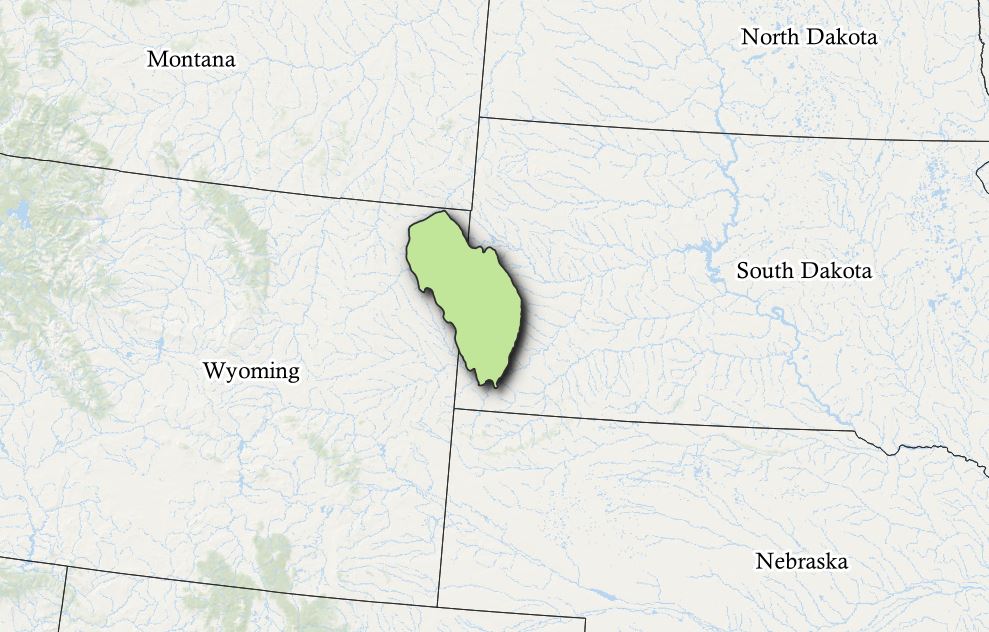
Location of the Black Hills landscape
Randy Swaty, Stacy Cotey, and I used data from the LANDFIRE program (www.landfire.gov0. We examined historical fire regimes (frequency and severity) and current vegetation conditions within the dominant ecosystems. The goal was to identify opportunities and needs for vegetation management in the Black Hills. We used R studio and based our assessment on code that Myles Walimaa created (e-mail Randy Swaty rswaty@tnc.org for more information). We were able to create charts and maps that showed Biophysical Settings (historical ecosystems), Historical Mean Fire Return Interval, Existing Vegetation Cover, and Vegetation Type (EVT and EVC represent conditions as of 2016).
We share some maps and charts below.
Historical Vegetation with conversion to agriculture and urban land uses highlighted
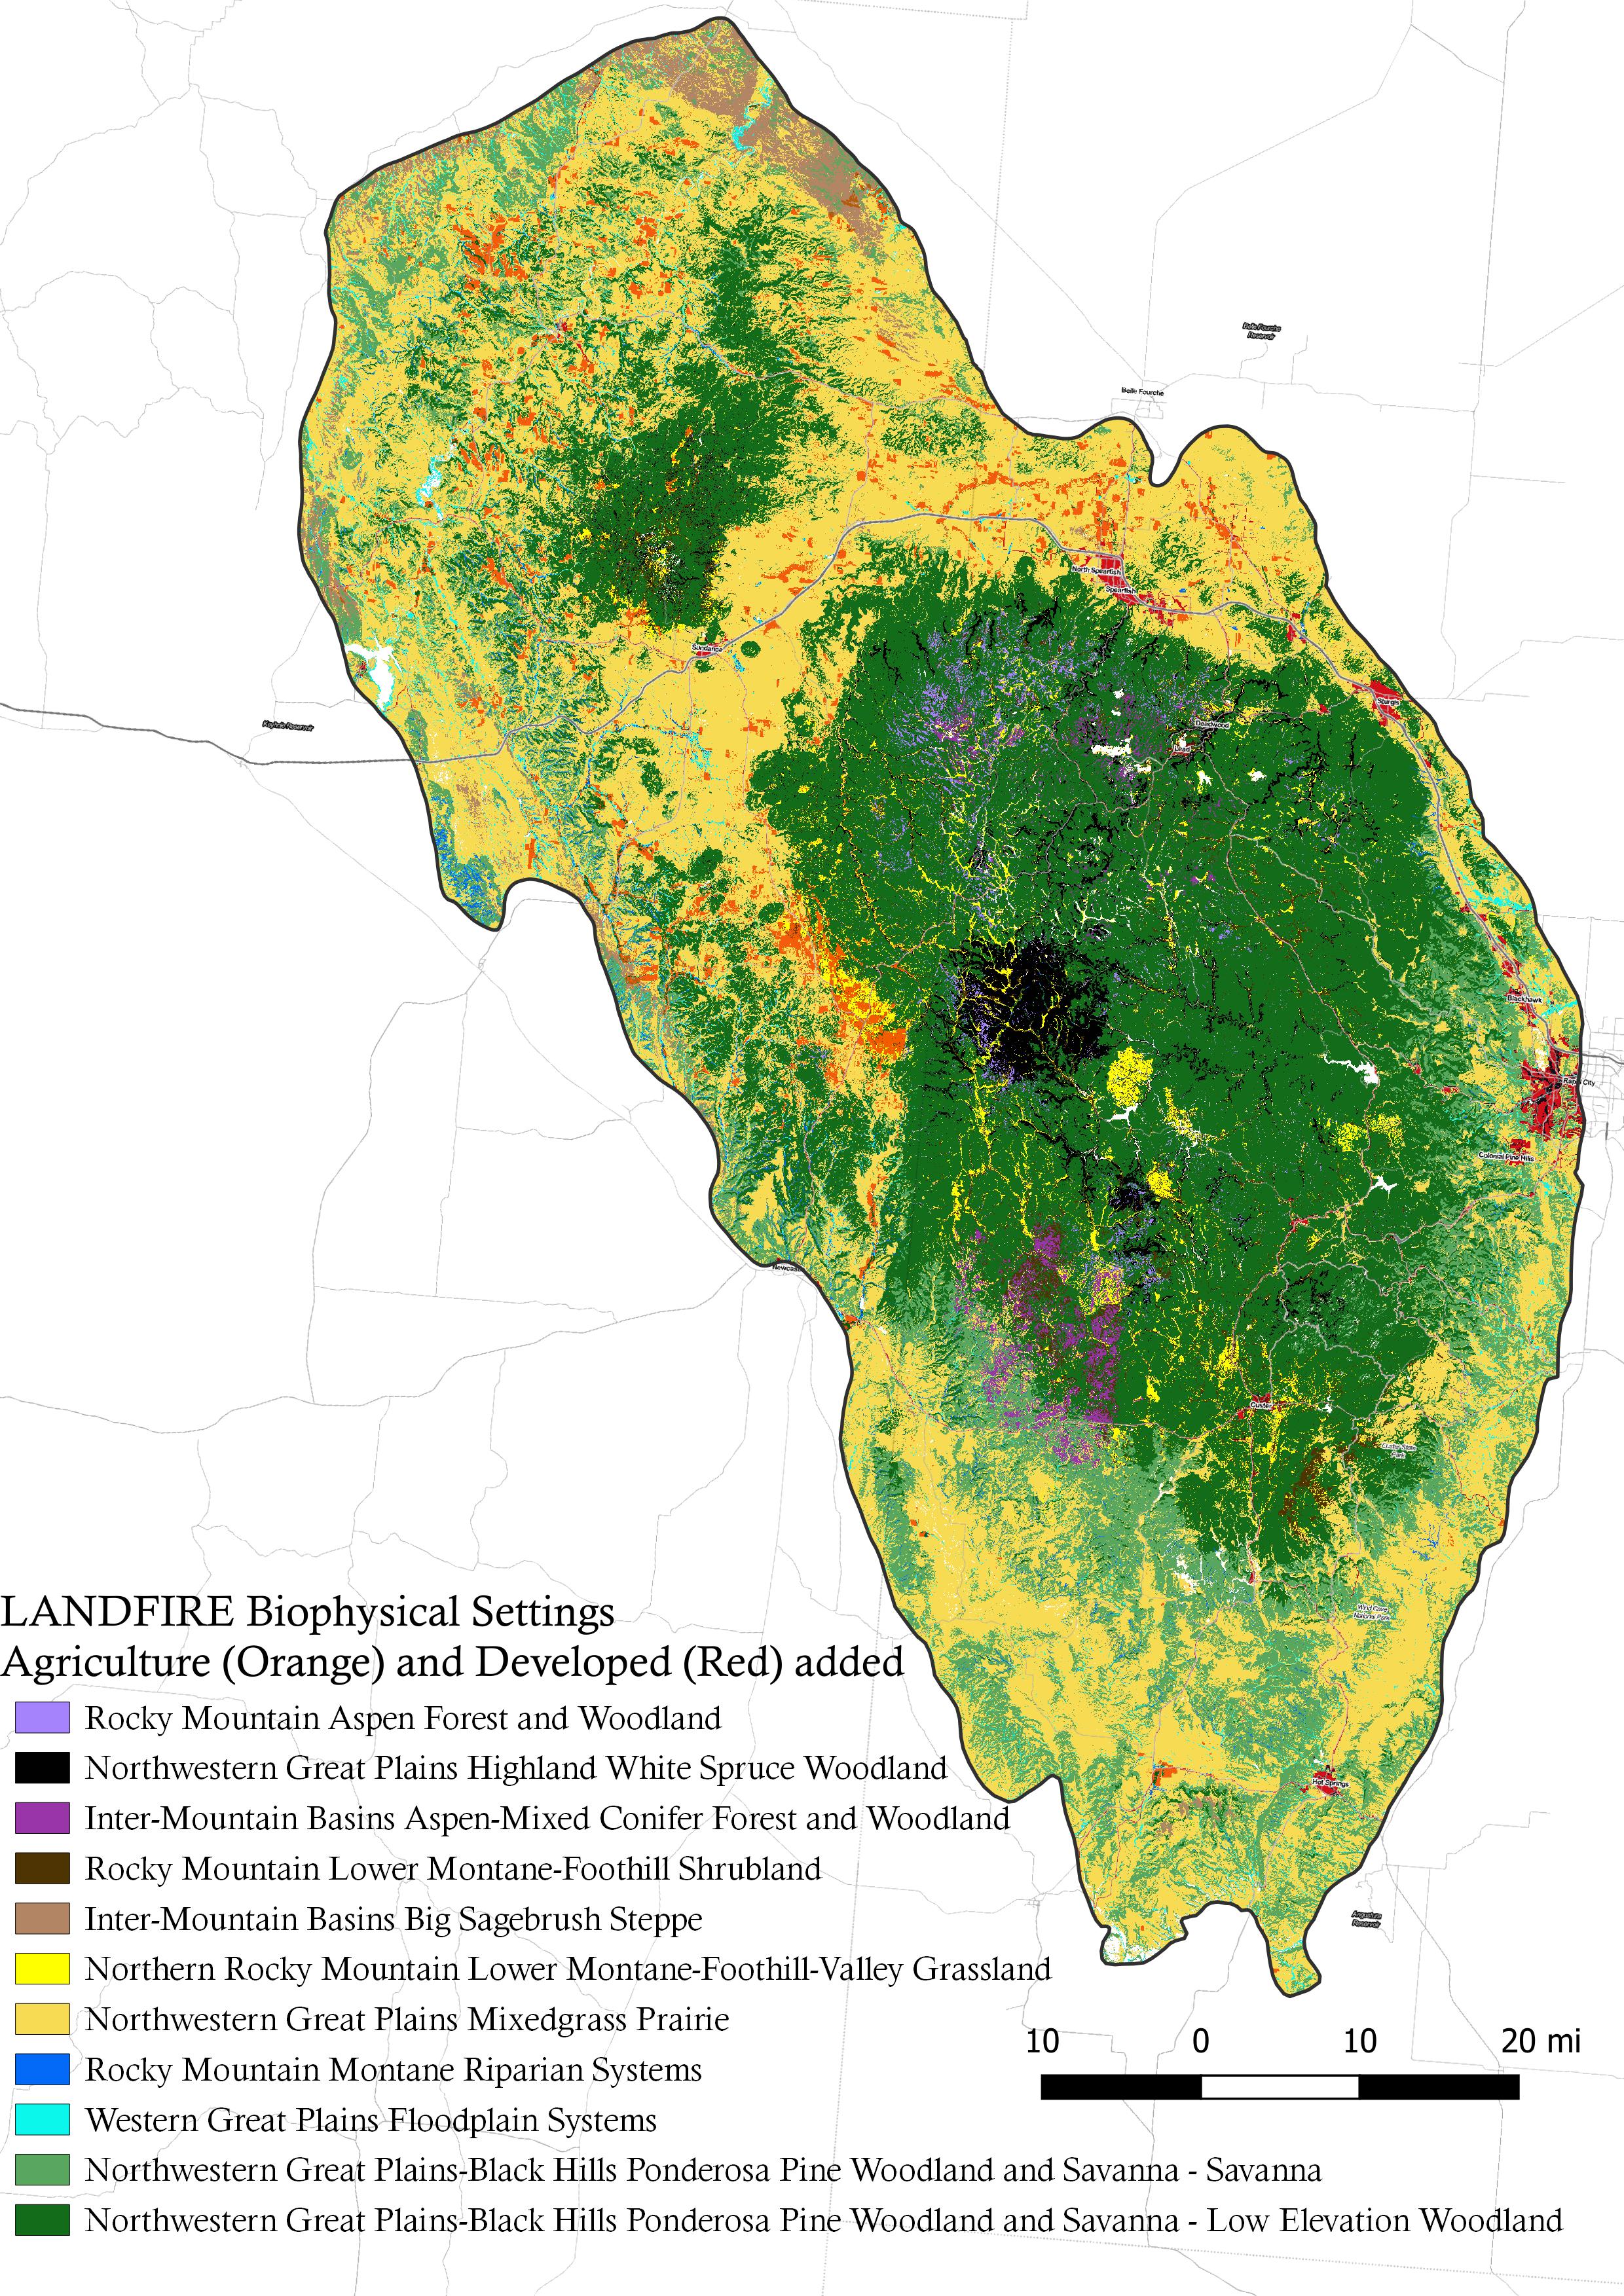
The area was dominated by Mixedgrass Prairie and Ponderosa Pine Woodland and Savanna historically.
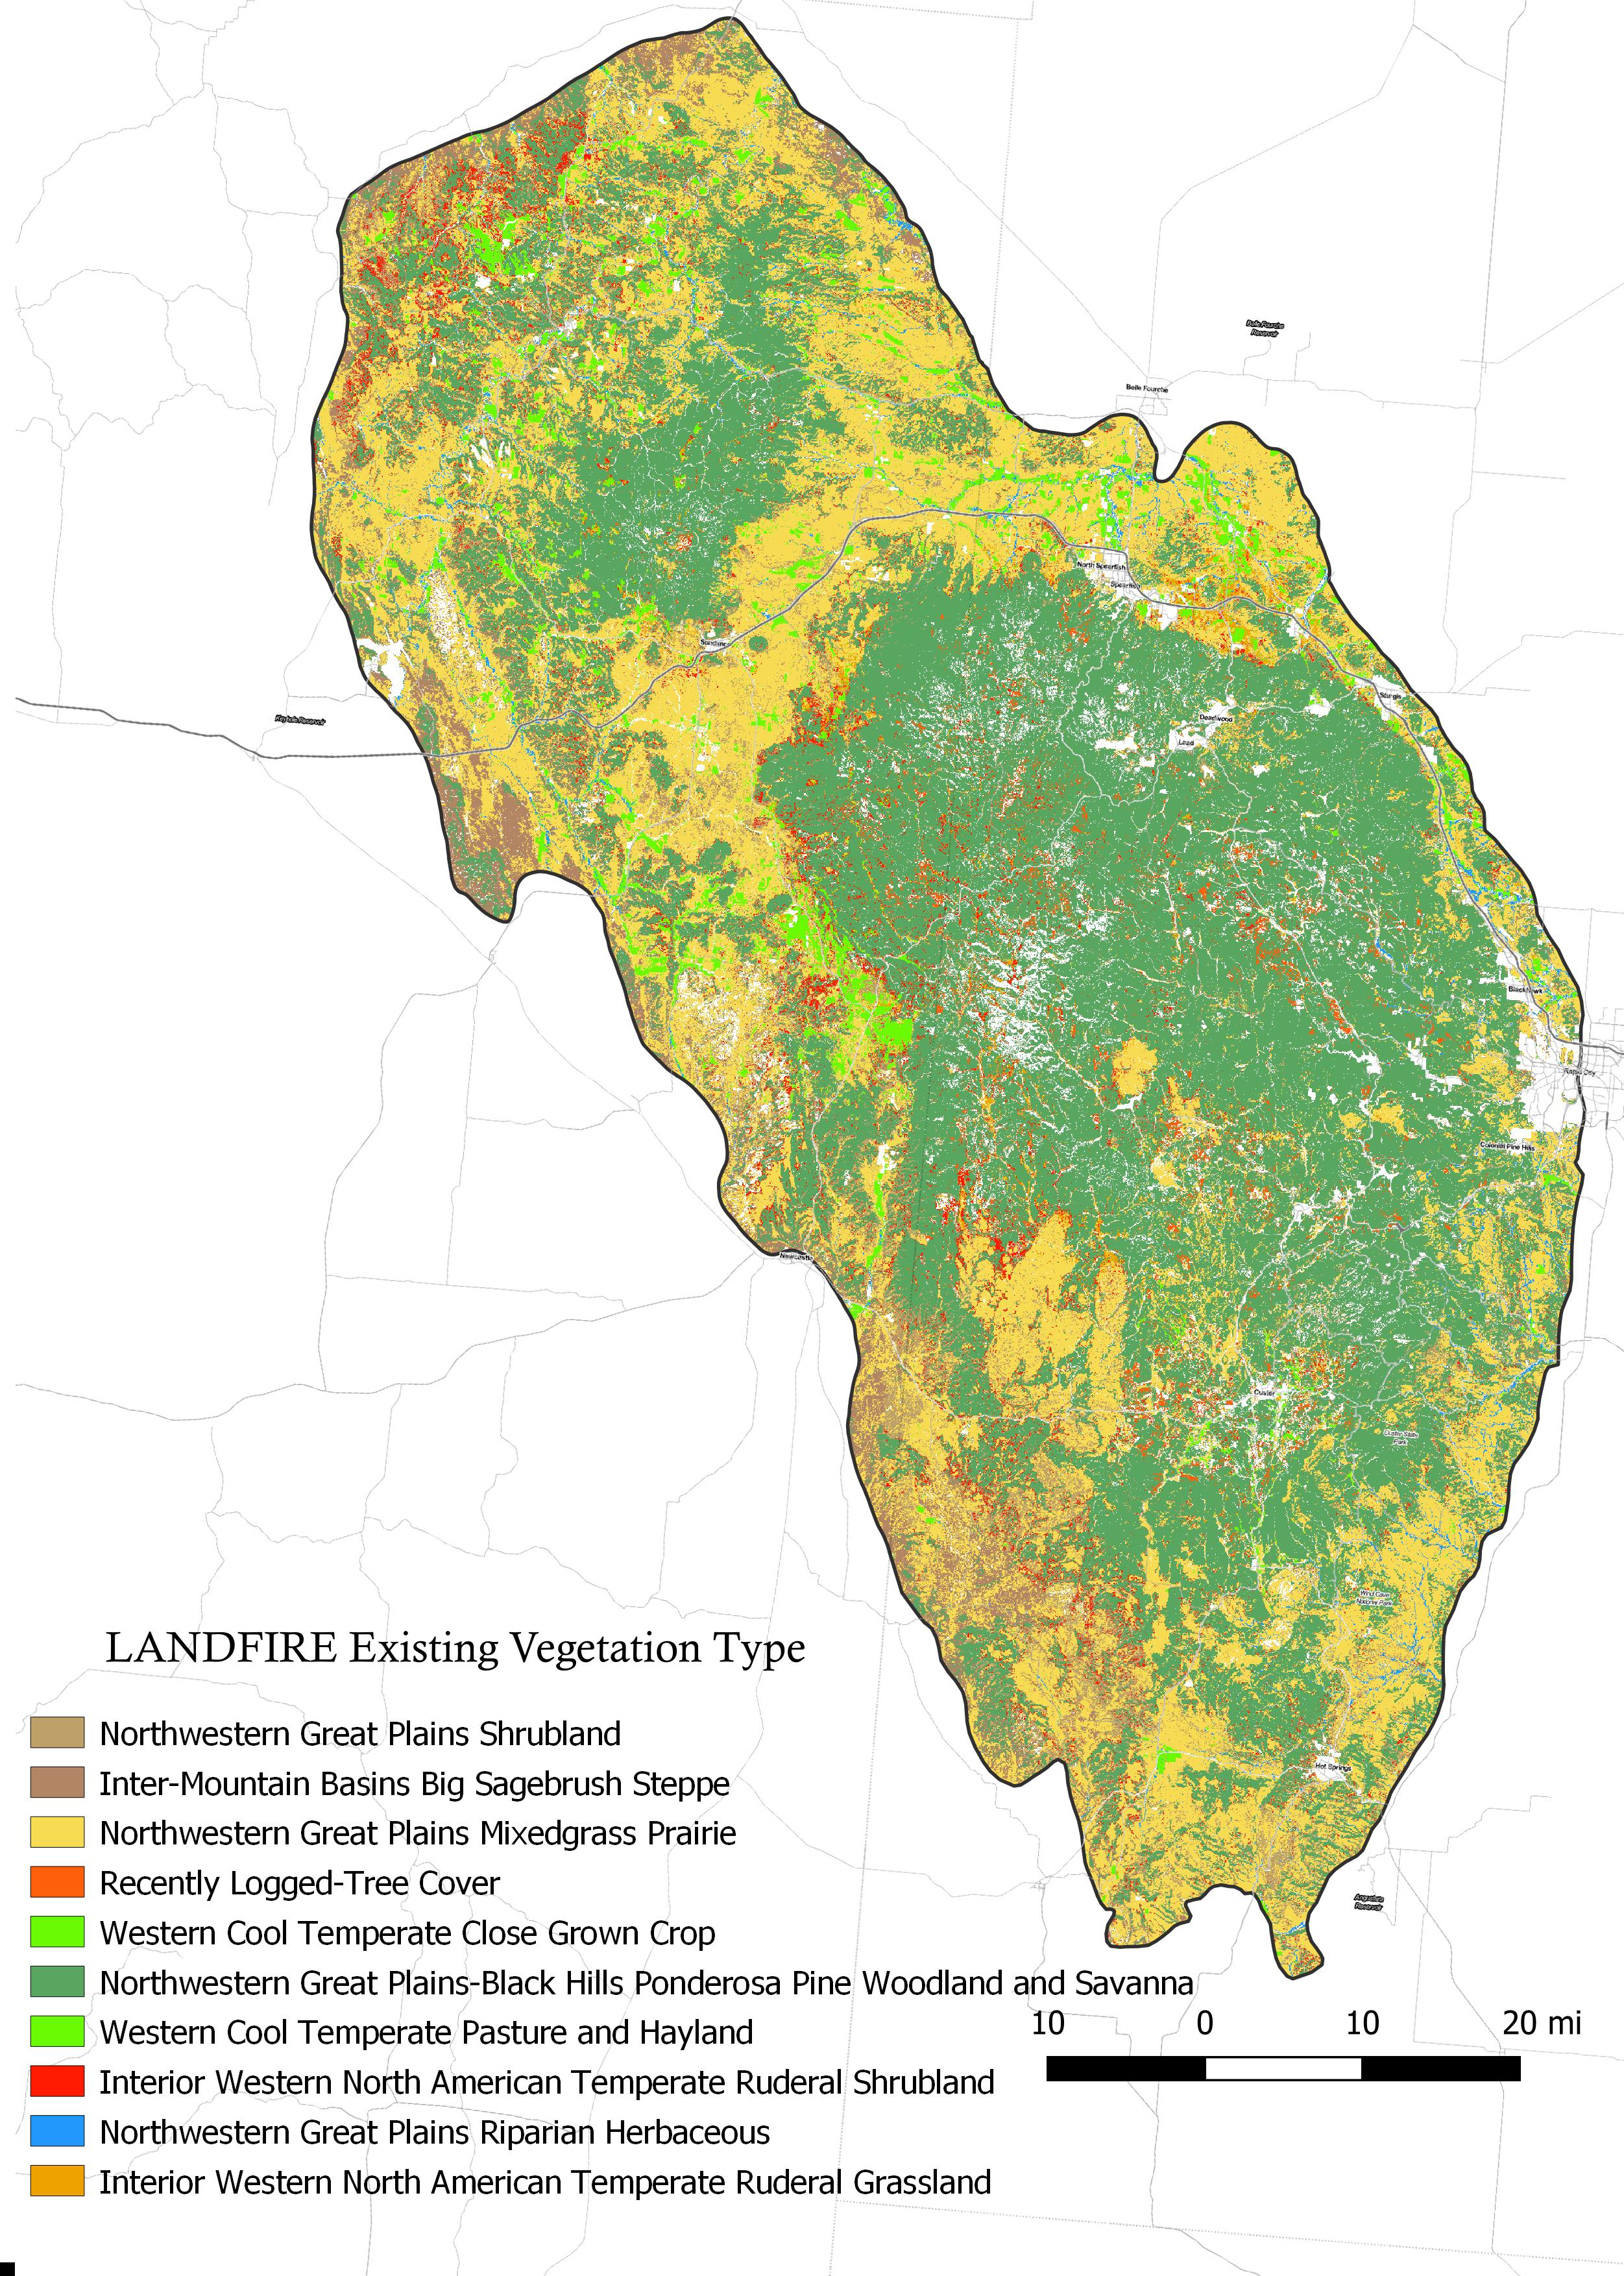
Existing Vegetation Type
There has been some change…you can explore in this “chord diagram”. A few notes about this chart:
- “BPS” refers to “Biophysical Setting”, or historical vegetation (https://www.landfire.gov/bps.php).
- “EVT” refers to “Existing Vegetation Type” or current vegetation (https://www.landfire.gov/evt.php)
- If you hover your cursor over “BPS Grassland” and follow the bands to the left, you can explore how it has changed. For example you’ll note that some has been converted to agricultural land use, and some has been developed. Most of what was grassland still is in this landscape.
- Conversely if you place your cursor over “EVT Agriculture” you will see that most of what is now agricultural lands once was grassland.
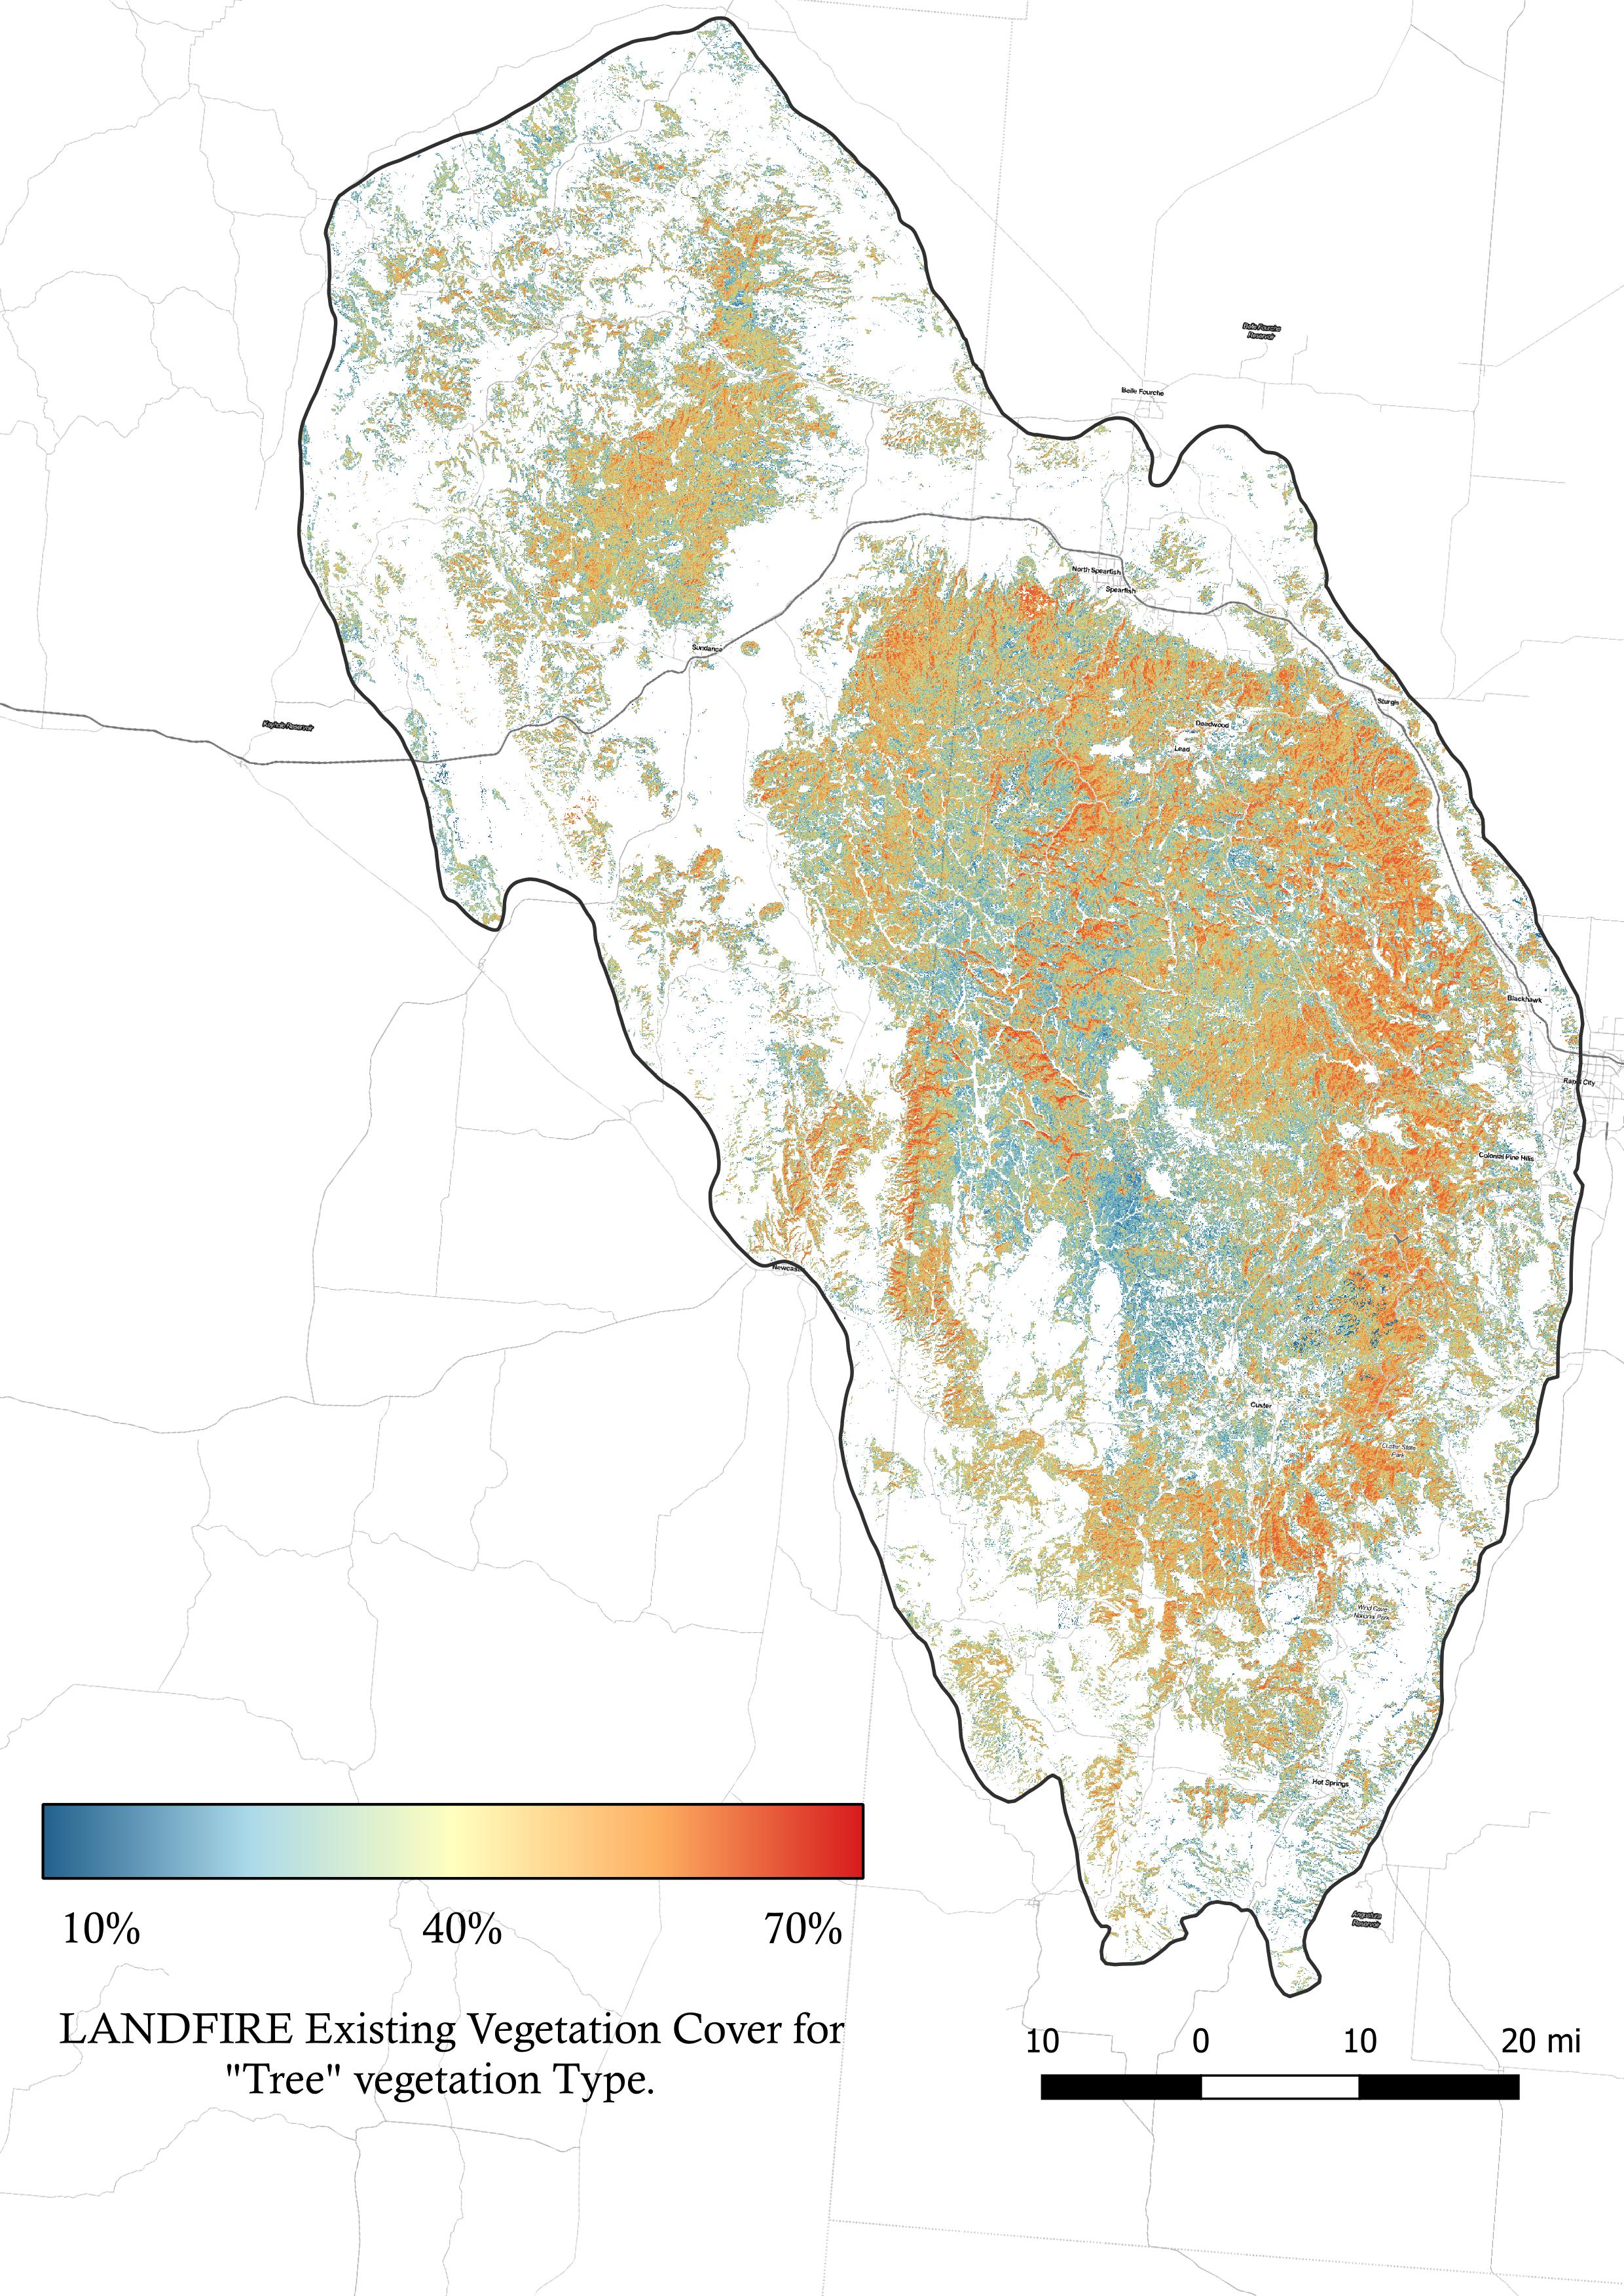
We also explored some structural characteristics:
Percent Canopy Cover of treed vegetation types