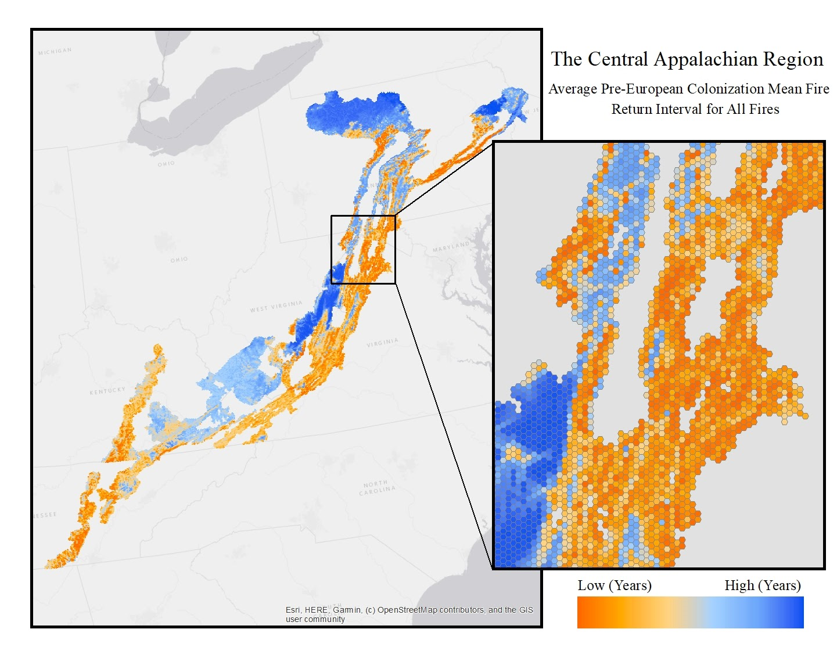
Map of historical fire return intervals for all types of fire (surface, mixed and replacement combines), or the number of years between any kind of fire. They range from ~4 years (oranges) to more than a 1,000 years (blues).
In an effort to aid forest managers in the restoration of fire-adapted ecosystems of the Central Appalachian region, we created maps depicting the historical fire regime. More specifically, we created hexbin maps in which each hexagon displayed the average Mean Fire Return Interval (MFRI) of that area.
I started with a shapefile of the area and the most recent Biophysical Settings data developed and delivered by the LANDFIRE Program (www.landfire.gov). This dataset represents the dominant vegetation systems that would have been on the landscape prior to major European settlement, which includes attributes representing the return intervals of surface (0-25% top kill of vegetation), mixed (26-75% top kill), replacement (76-100% top kill) and all fire (a composite of the 3 fire types). Ultimately, four separate maps were created.
I encountered several problems including:
- Initial creation of the hexbins. Solved using the Tessellation Tool.
- Attributes that were not in a useful data type. In order to deal with this, I first exported the attributes as a .csv file, then cleaned them up in Excel. Once cleaned up, I joined them back to the original dataset.
- Inability to calculate mean values for each hexagon based on specific attribute (e.g., surface fire). That is, I needed to calculate mean values for each of the desired attributes in the BpS dataset, but the calculation tool (Zonal Statistics as Table) only calculates on the VALUE field. To fix this I used the LOOKUP tool to create four new rasters, with each one having the VALUE field represent the fire type of interest (e.g., surface).
Once I had the hexbins, and 4 rasters with VALUE fields representing the appropriate fire return intervals, the rest was relatively straightforward. Using the aforementioned Zonal Statistics as Table tool, I generated various fire regime statistics per hexagon, and then joined the resultant table into the hexagon shapefile. After the information was joined, I exported the shapefile. This process was repeated four times to generate the four output maps shown below. It was a pleasure working on this project, especially since I was completely new to this GIS program. While jumping right into a project working with a program I had never used was overwhelming at times, it allowed me to connect with knowledgeable professionals, such as Rachel Meier, who were able to answer any questions I had or help me work through the process of learning the program. It was also reassuring to find that some of the issues we stumbled upon were not so easily answered by well-experienced associates. Overall, this was a great experience. I appreciate all my new knowledge of the Central Appalachian Mountains and what I have learned about ArcMaps.
More maps!
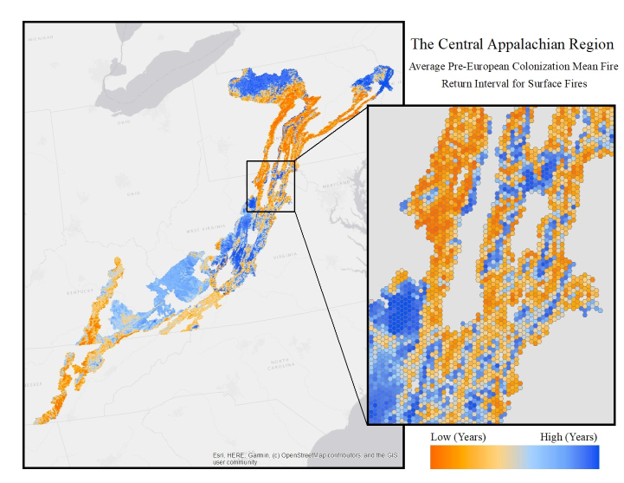
Map of historical fire return intervals for surface fire (kills < 25% of the above ground vegetation), or the number of years between surface fires.
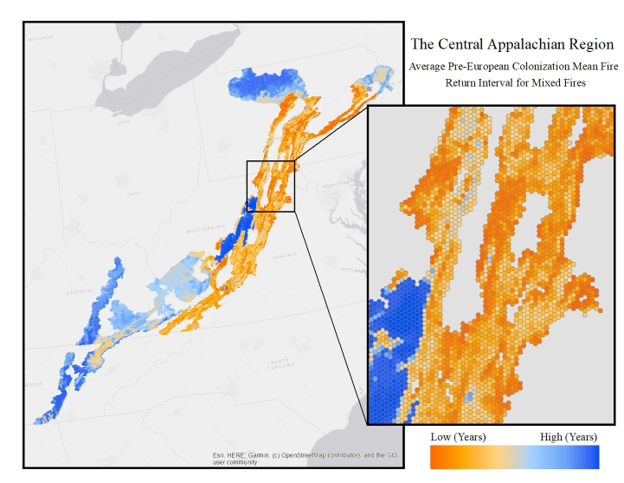
Map of historical fire return intervals for mixed fire (kills 25-75% of the above ground vegetation), or the number of years between mixed fires.
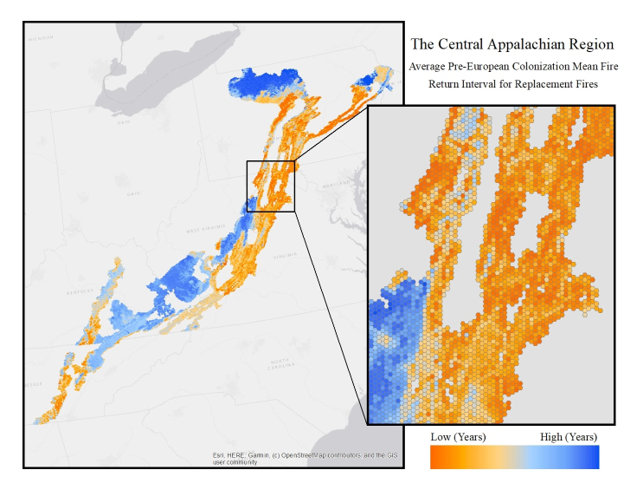
Map of historical fire return intervals for replacement fires (kills > 75% of the above ground vegetation), or the number of years between replacement fires.