Green is good…
Vegetation Departure for the lower 48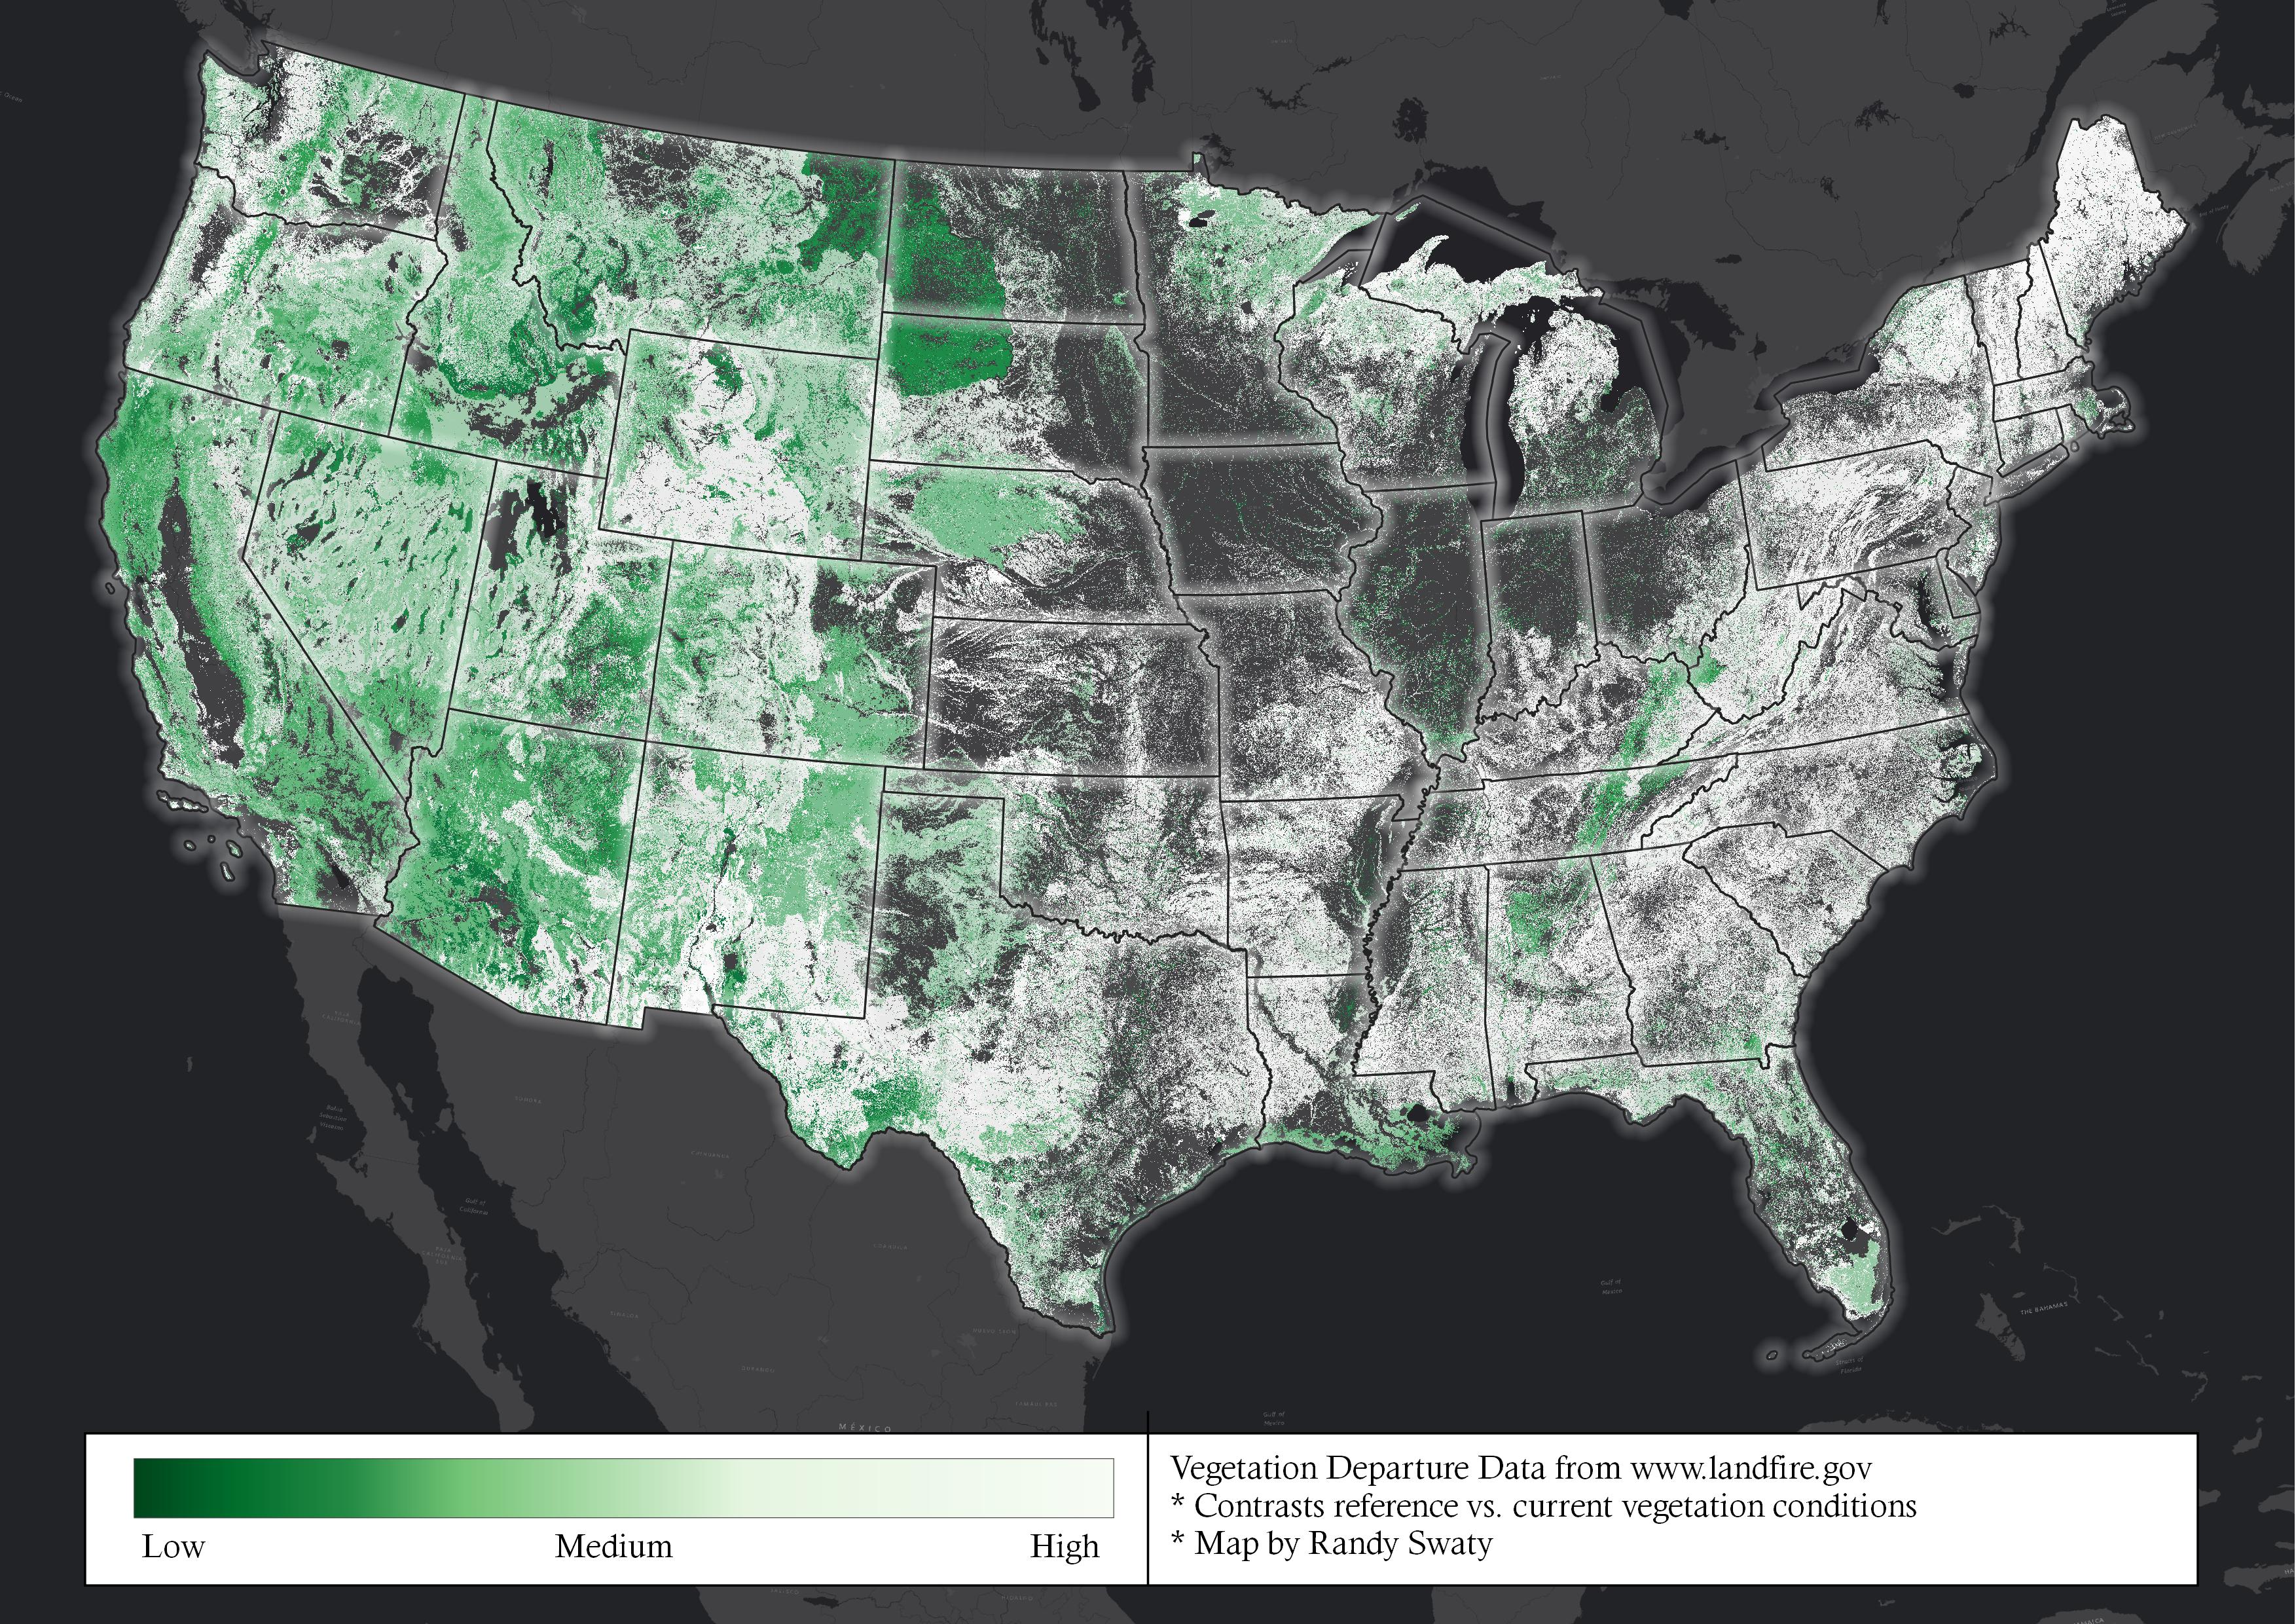
Figure 1: LANDFIRE’s Vegetation Departure. Green areas represent low levels of Vegetation Departure, white areas high levels, and black represents urban and agricultural land use, and water.
at least if you are comparing “reference” to current vegetation structure using LANDFIRE’s Vegetation Departure data. What does all of that mean?
- LANDFIRE: a federal program that delivers vegetation, fire and fuels data for the U.S.
- Reference: every ecosystem has “states” developmental stages (in a human this would be infant, toddler, etc.). How much of those states were on the landscape historically with natural disturbance regimes? These amounts comprise “reference”. Each state is characterized by it’s structure. In LANDFIRE an ecosystem can have up to 5 states. See chart below.
- Structure: In LANDFIRE structure for each state is characterized by how tall the vegetation is, and how dense it is.
- Vegetation Departure: the difference between how much of those states would have been on the landscape historically, and how much is there today. LANDFIRE delivers a dataset you can use to map this like I did above at https://www.landfire.gov/vdep.php
- Oh! Coterminous: having the same boundaries. For the U.S. the lower 48 states are coterminous.
In the map above green pixels or areas represent ecosystems that are closer to having reference amounts of the states compared to the white areas. The black areas represent agricultural or urban land uses, and water.
About these so called “Reference” conditions
As noted above reference conditions essentially equal how much of each state an ecosystem had historically, or pre-European colonization. To get reference conditions The Nature Conservancy’s LANDFIRE team held dozens of workshops with hundreds of experts to build ecosystem models in software called SyncroSim. In each model we entered detaisl such as:
- Information on the states, including how many (up to 5) and the age range
- Disturbance estimates, i.e., what kinds of disturbances (e.g., flooding, fire, wind) happened in each state, and what was the result of that disturbance. For example did the fire “set back” the ecosystem, returning it to it’s starter state? Or merely maintain things?
- Succession details, or what happens to an acre of a state if it is not disturbed by the maximum age for that state
We then ran the models to get the expected amounts of each state. We then mapped how much of those states are on the landscape today and did a little math to come up with a value from 0 to 100 for each ecosystem. The figure just below illustrates the basics for 3 ecosystems.
For much more information, and even tutorials for how to explore and change the models visit https://thenatureconservancy.github.io/landfiremodels/index.html, a website built by The Nature Conservancy’s LANDFIRE team.
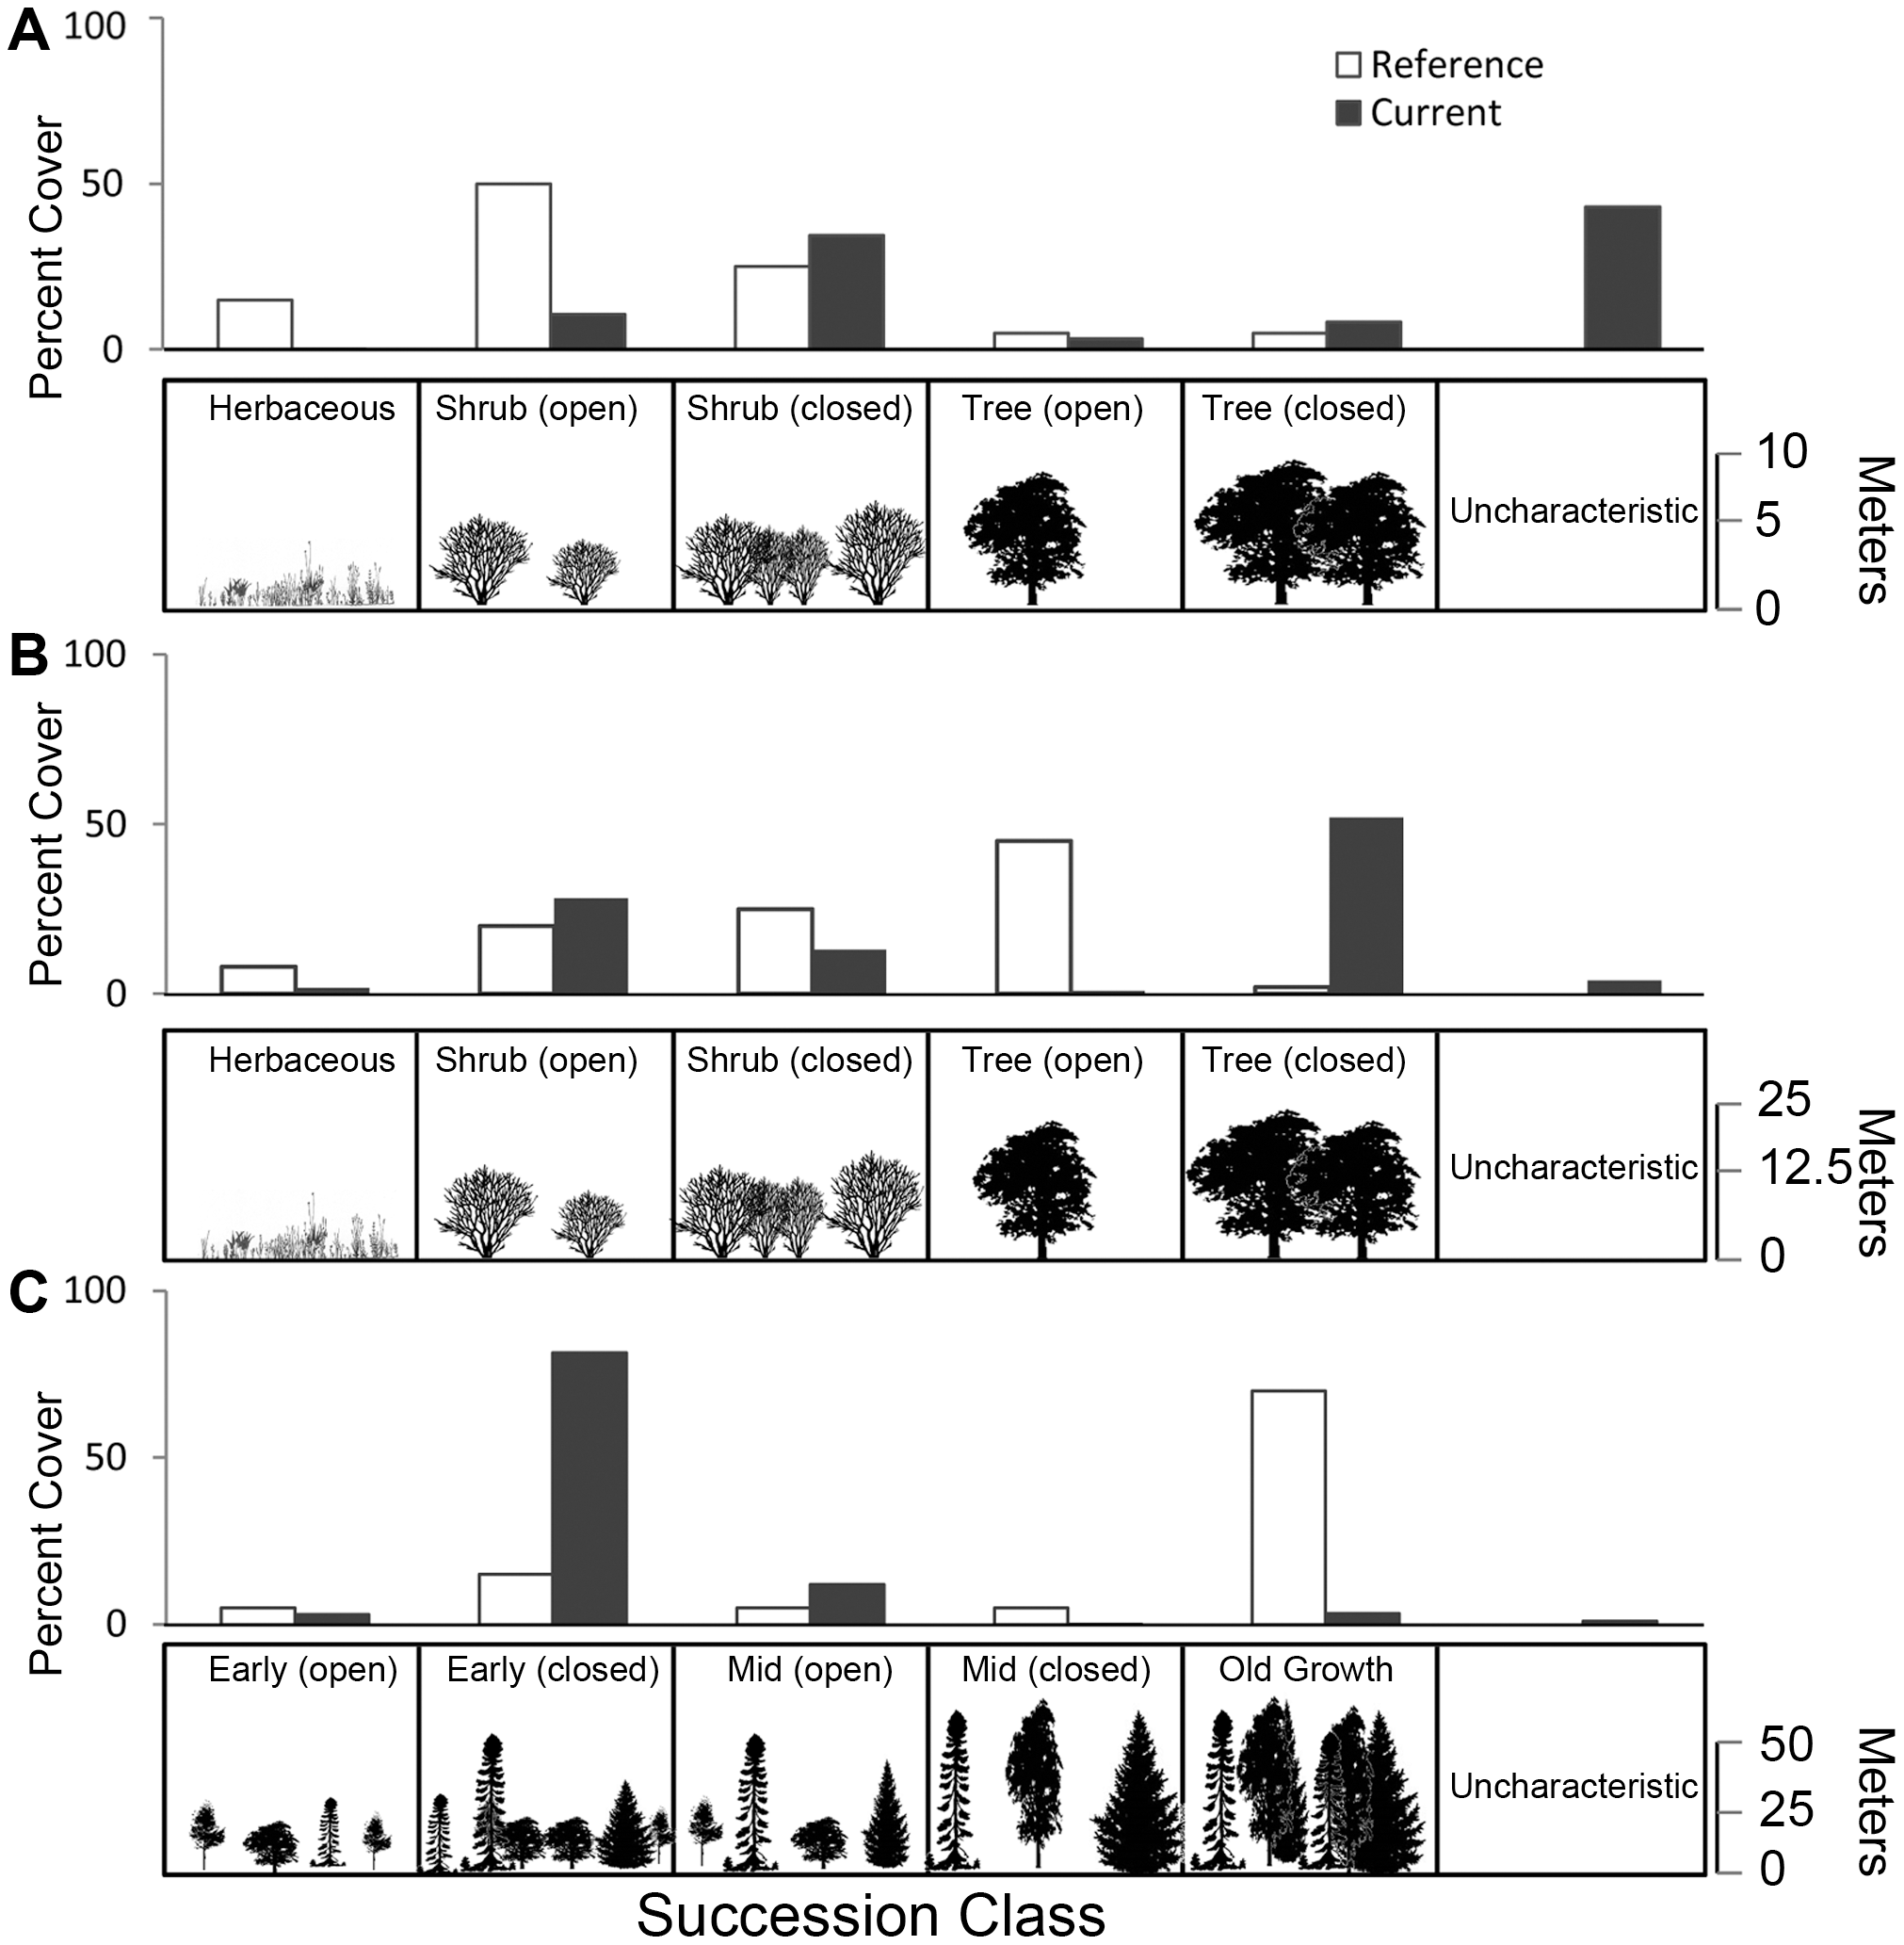
Figure 2: Example of how Vegetation Departure works. Current and reference successional classes for three ecosystems. Departure from reference conditions can be caused by (A) increases in uncharacteristic vegetation, as in Great Basin Salt Desert Scrub, (B) increases in closed canopy successional classes, as in Ozark Oak Woodland, or (C) increases in early successional classes, as in Cascades Western Hemlock Forest. These vegetation changes are the expected outcomes of biological invasion, fire suppression, and logging, respectively. From Swaty et al., 2011
If green is good, is white bad?
It depends. The white areas in the map above indicate areas where the amounts of states within the ecosystems vary a lot between reference and current. For example, if historically an ecosystem had little of a “tall and dense forest” succession class but has substantial amounts of that today such as in B above, Vegetation Departure would be high.
Good and bad are in the eye of the beholder. If high levels of departure mean there is more of a succession class that the humans in the area like, or value then they might think that high levels of departure are a good thing. Often though that is not the case. In the western United States the white areas are often ones that are likely to have catastrophic wildfires.
Additionally, reference conditions look backwards. They are super valuable for understanding how an ecosystem used to look and work, and can inform managers in a changing climate, but do not incorporate invasive plants and pests, human uses (e.g., logging), climate change or other modern disturbances.
Whether or not a particular is good or bad is ultimately up to local stakeholders to decide. I just hope these and other datasets promote informed discussion focused on issues and collaborative learning about the world around us, and how we interact with it.